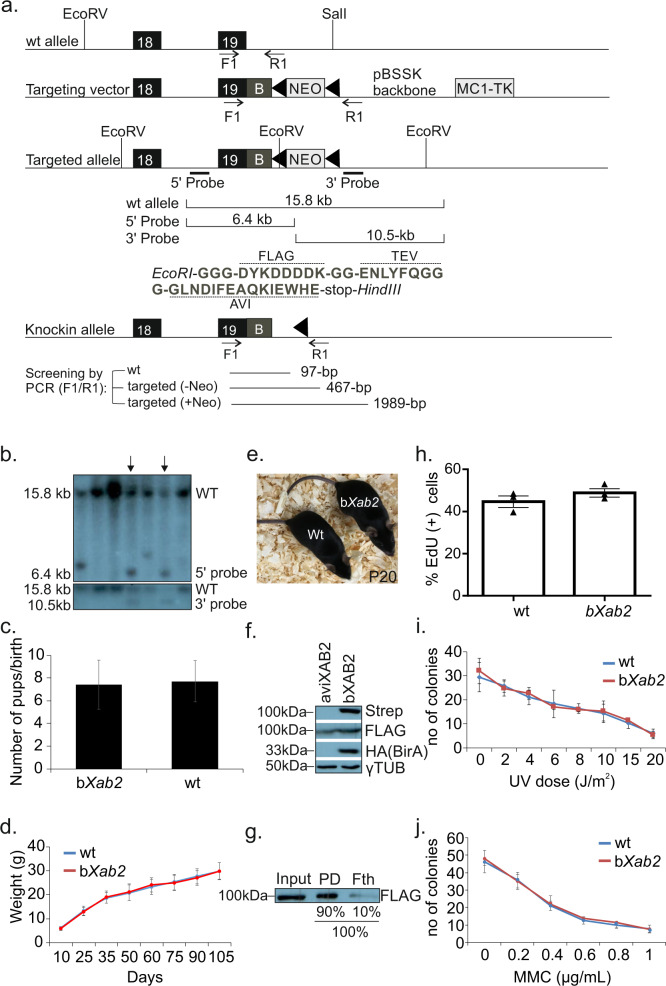
Fig. 1. Generation of biotin-tagged XAB2 animals.
a Schematic representation of knock-in mice expressing XAB2 fused with the 1xFLAG tag, a 15aa Avi tag sequence and a Tobacco Etch Virus (TEV) site separating the two tags. EcoRI and HindIII sites are synthetic; b: Flag-Tev-AVI fragment. b Two independently transfected ES clones (marked with arrow heads) were used to generate germline transmitting chimeras that were backcrossed with C57Bl/6 mice to generate aviXab2+/- pups. Homozygous aviXab2+/+ knock-in animals (aviXAB2) were then crossed with mice ubiquitously expressing the HA-tagged BirA biotin ligase transgene (aviXab2+/+;birA, designated as bXAB2). c Average number of wt (n = 185 pups/24 birth events) and bXAB2 (n = 319 pups/44 birth events) pups born per birth event. d Weight (grams; g) of wt. and bXAB2 animals (n = 8) at the indicated time points. e A photograph of P20 wt. and bXAB2 animals. f In vivo biotinylation of the short 15aa Avi-tag in bXAB2 animals. Nuclear extracts from P15 livers of mice expressing either only aviXAB2 (XAB2) or aviXAB2 and BirA biotin ligase (bXAB2) were tested by Western blot. The blot was probed with streptavidin-HRP (stp-HRP), anti-FLAG and anti-HA. g Biotinylation efficiency in bXAB2 livers. The percentage of biotinylated XAB2 in the pulldown (PD) and (90%) and flow through (Fth) fraction (10%; fth) was calculated by performing pull-down with 0.7 mg of nuclear extract derived from 15-day old bXAB2+/+;BirA livers and M-280 paramagnetic beads in excess. h % of EdU (+) MEFs derived from bXAB2 (n = 324 cells examined /3 independent experiments) and wt. mice (n = 480 cells examined/3 independent experiments) 2.5 h after UV irradiation. i Survival of primary bXAB2 and wt. MEFs to UV (n = 3 per time point) or (j). MMC at the indicated doses (n = 3 per dose point). The images shown on Fig. 1f and g are representative of experiments that were repeated three times. Error bars indicate SEM. among n = 3 biological replicates, unless otherwise stated. All scatter and bar blots in this manuscript are presented as mean ± SEM. P values were calculated by two-tailed Student’s t test. Source data provided as a Source Data file.

