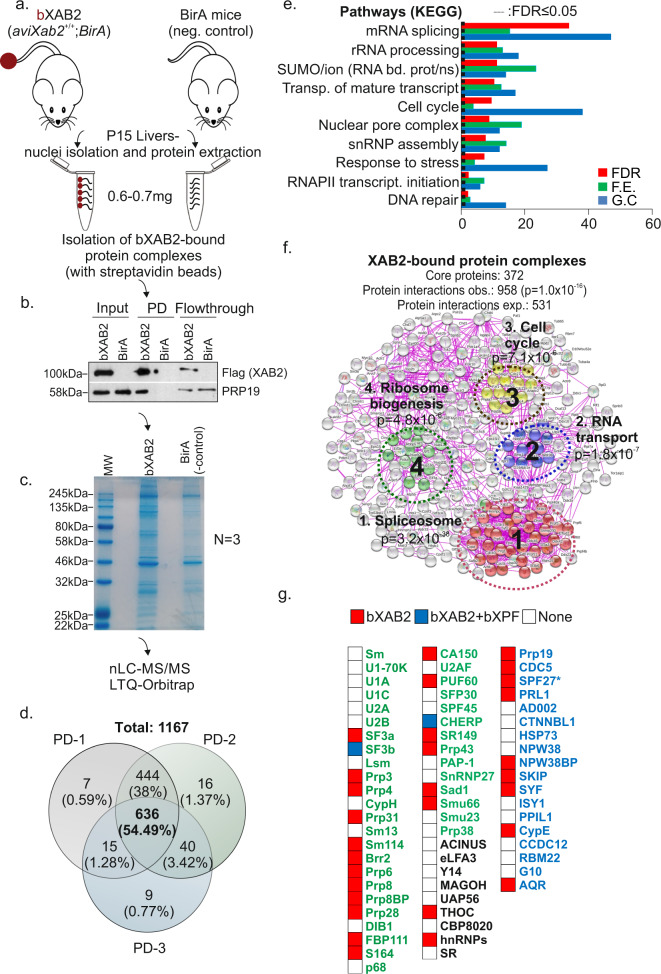
Fig. 2. XAB2 interacts with protein complexes involved in transcript maturation.
a Schematic representation of the isolation of bXAB2 complexes derived from livers of P15 bXAB2 animals expressing the BirA transgene and BirA transgenic control mice. b bXAB2 pulldowns (PD) and western blot with anti-FLAG (for XAB2) and anti-PRP19 in nuclear extracts derived from P15 bXab2 and BirA livers (n = 3 livers). c A representative SDS-PAGE gel of proteins extracts derived from P15 XAB2 and BirA transgenic mice. d Venn’s diagram of bXAB2-bound protein factors from three independent pull-downs (PD) and subsequent MS analyses; % depicts the percentage of XAB2-bound proteins involved in the indicated biological process over the total number of XAB2-bound proteins (e). List of significantly over-represented pathways (KEGG). The −log(FDR: False Detection Rate), which is calculated by Fisher’s exact test right-tailed (one-sided), sorts the biological processes. The red-dotted line marks the threshold of significance at FDR ≤ 0.05. Count (G.C.): the number of identified XAB2-bound protein factors involved in the indicated biological process. F.E. (Fold Enrichment), represents the ratio of XAB2-bound proteins involved in a process (sample frequency) to the total genes involved in the process (background frequency). f Number of observed (obs.) and expected (exp.) known protein interactions within the core 372 XAB2-bound protein set and schematic representation of the four significantly over-represented XAB2-bound protein complexes based on experimental evidence. g Heat map representation of bXAB2- and bXPF-bound proteins involved in the core spliceosome in P15 bXAB2 and bXPF livers. Constitutive factors of snRNPs are green-colored; the PRP19 and the PRP19-related complex are blue-colored. Protein components of the TREX and exon junction complex are black-colored. SPF27 (BCAS2) is marked with an “*” as it has been identified in two out of the 3 MS runs in P15 bXAB2 livers but has been further confirmed in downstream immunoprecipitation/pulldown assays. The images shown in Fig. 2b and c are representative of experiments that were repeated three times. All scatter and bar blots in this manuscript are presented as mean ± SEM. P values were calculated by two-tailed Student’s t test, unless otherwise indicated. Source data provided as a Source Data file.

