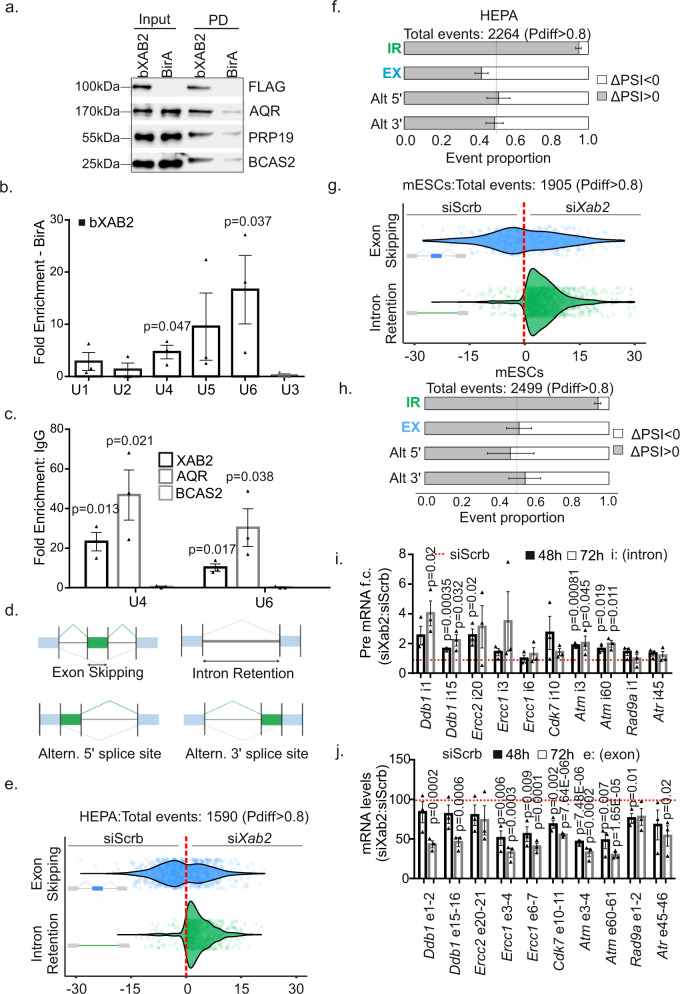
Fig. 4. XAB2 is part of a core spliceosome complex.
a bXAB2 pulldowns and western blot analysis of AQR, FLAG-tagged XAB2 (FLAG), PRP19, and BCAS2 proteins in P15 bXAB2 livers. b RNA pulldowns with bXAB2 and BirA (control) on U1-U6 UsnRNAs (as indicated). U6 p-value calculated by one-tailed Student’s t-test. c RNA immunoprecipitation with XAB2, Aquarius and BCAS2 on U4 and U6 snRNAs (as indicated). d Schematic representation of splicing decisions, i.e., exon skipping, intron retention, and alternate (Altern.) selection of 5′ or 3′ splice sites. e, g Graph depicting the differences in Percent Spliced-In (PSI) between siXab2 and siScrb HEPA and mESCs cells respectively (ΔPSI > 0: increased alternative exon/intron inclusion in siXab2 and ΔPSI < 0: decreased alternative exon/intron inclusion) in siXab2 compared to siScrb cells. f, h Distribution of the direction of alternative splicing changes between siXab2 and siScrb HEPA and mESCs cells, respectively. Represented is the observed proportion of positive (ΔPSI > 0, in gray) values for each event type, with the error bar reflecting its 95% confidence interval, based on a Pearson’s chi-squared proportion test as explained in “Methods” (i). Pre-mRNA levels and (j) mRNA levels of transcripts with retained introns in siXab2 and siScrb HEPA cells at 48 and 72 h post-transfection (as indicated). The images shown in Fig. 4a, e, g are representative of experiments that were repeated three times. The RIP signals are shown as fold enrichment (F.E) of % input antibody or bXAB2 over % input control antibody (IgG) or BirA. All scatter and bar blots in this manuscript are presented as mean ± SEM. P values were calculated by two-tailed Student’s t test, unless otherwise indicated. Error bars indicate SEM among three biological replicates in all cases. Source data provided as a Source Data file.

