
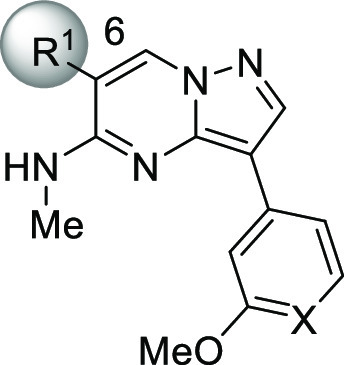
Table 2. Initial SAR Exploration.
| enzyme
IC50 (μM)a |
cell
IC50 (μM)b |
||||||
|---|---|---|---|---|---|---|---|
| compd | R1 | X | TGF-βRII | ACVR2A | ALK5 | TGF-β | activin |
| 5 | H | CH | 1.0 | >20 | NTc | >38 | NT |
| 6 | H | N | 0.0039 | 1.1 | 4.1 | 4.8 | 14 |
| 7 | Me | N | 0.0029 | 1.3 | 2.0 | 5.4 | 22 |
| 8 | vinyl | N | <0.003 (82%) | 0.19 | 1.4 | 0.38 | 4.1 |
| 9 | Et | N | 0.0015 | 0.70 | 1.9 | 1.3 | 11 |
| 10 | c-Pr | N | 0.0037 | 0.63 | 8.9 | 6.9 | 12 |
| 11 | MeO | N | 0.0010 | 0.31 | 0.71 | 0.33 | 4.8 |
a
IC50 values are mean values determined from three replicates.
b
Values of IC50 are mean values determined from four replicates.
c
NT = not tested.