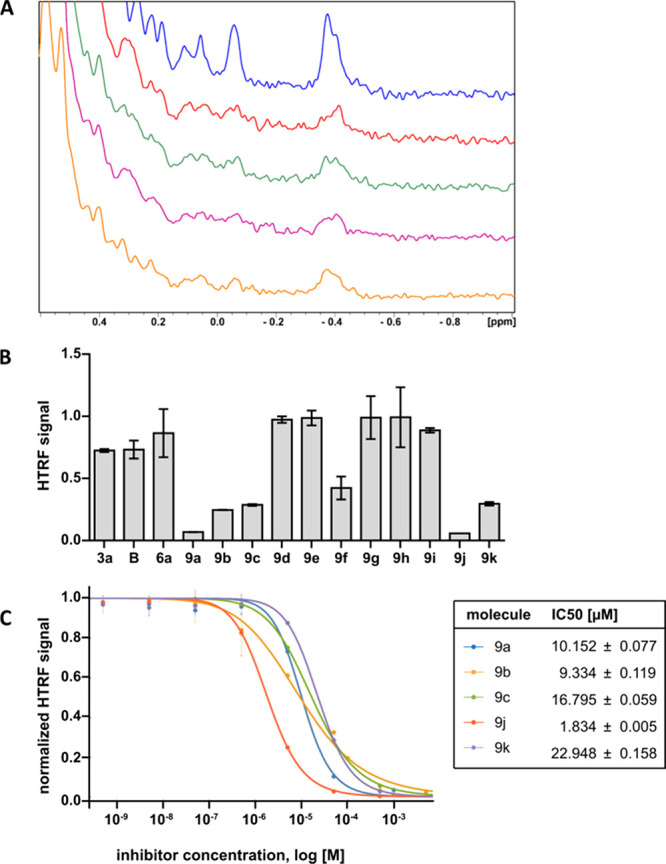
Figure 2.

Binding studies. (A) Aliphatic part of the 1H NMR spectrum of PD-L1 (blue) and PD-L1 with compounds 9a (red), 9b (green), 9c (purple), and 9f (orange) in a 1:1 molar ratio. (B) HTRF scouting based on a concentration of 50 μM. (C) HTRF inhibition assay and calculated IC50 values for the best compounds from HTRF scouting.
