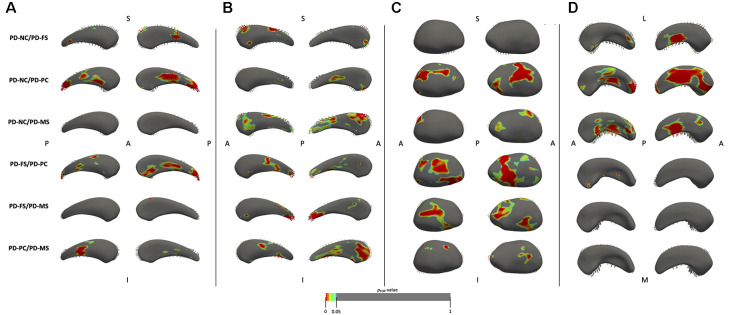
Figure 3.
Results of the shape analysis for the left (A) and right (B) caudate nuclei, the right thalamus (C), and the right hippocampus (D). For the caudate nuclei and thalamus, medial face is shown on the left and lateral face on the right. For the hippocampus, superior face is shown on the left and inferior face on the right. Vectors represent the magnitude and direction of deformation at each point (only vectors pointing outward are visible). Vectors are pointing from the second group mean shape to the first group mean shape (e.g., in PD-NC/PD-FS comparison, they are pointing from PD-FS to PD-NC). Results are displayed on the mean mesh built from all patients and are considered significant at pFDR < 0.05, corrected for age, sex, years of formal education, and center. One contrast is displayed per row. PD-NC, Parkinson’s disease—normal cognition; PD-FS, Parkinson’s disease—frontostriatal subtype; PD-PC, Parkinson’s disease—posterior cortical subtype; PD-MS, Parkinson’s disease—mixed subtype; S, superior; I, inferior; A, anterior; P, posterior; L, lateral; M, medial; FDR, false discovery rate.

