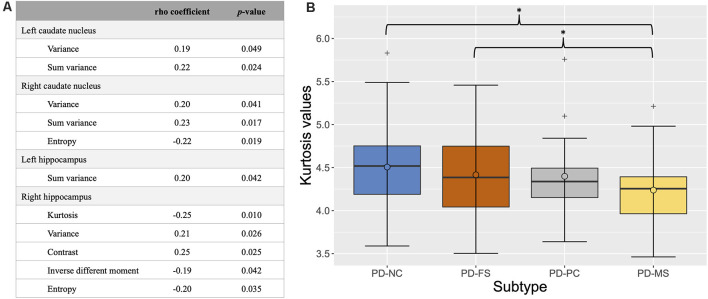
Figure 4.
Results of the feature selection strategy (A) and box plot of the kurtosis values in the right hippocampus according to cognitive subtype (B). In (A), only significant features are shown (p < 0.05). In (B), the thick bars represent the median, the circles the mean, and the crosses the outliers. *pFDR < 0.05 (corrected for age, sex, years of formal education, and center). PD-NC, Parkinson’s disease—normal cognition; PD-FS, Parkinson’s disease—frontostriatal subtype; PD-PC, Parkinson’s disease—posterior cortical subtype; PD-MS, Parkinson’s disease—mixed subtype; FDR, false discovery rate.

