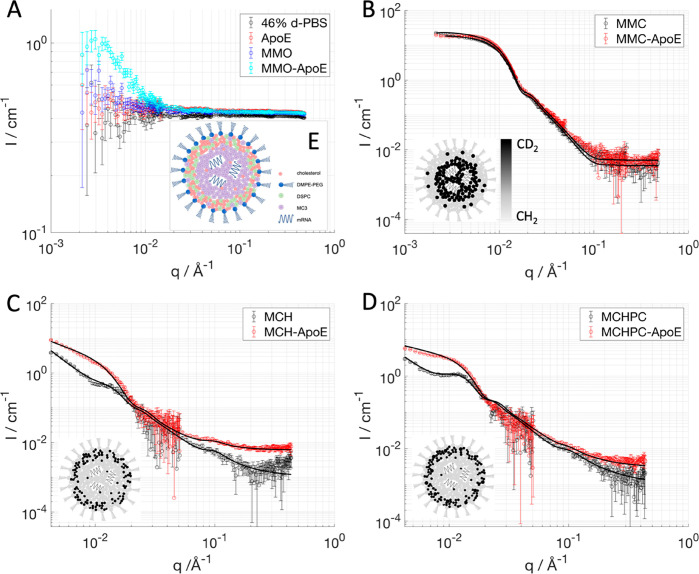
Figure 3.
SANS data collected for the LNPs prepared with a mixture of deuterated and hydrogenated components (MMO) that allows the LNPs to be matched out in a buffer with 46% D2O content and to enhance the structural effect of ApoE incubation for 3 h: solvent containing 46% d-PBS (black symbols), ApoE (red symbols), MMO with (light blue symbols) and without (blue symbols) ApoE (A). LNPs prepared with dMC3 (MMC) and measured at 46% d-PBS with (red symbols) and without (black symbols) ApoE (B). SANS data for LNP prepared with 100% d-cholesterol (MCH) measured in 39% d-PBS with (red symbols) and without (black symbols) ApoE (C). LNP prepared with 100% d-cholesterol and 32% dDSPC (MCHPC) measured in 39% d-PBS with (red symbols) and without (black symbols) ApoE (D). Schematics of how the particle composition changes upon apolipoprotein binding: cholesterol moves toward the surface while MC3 partitions to the core (E). Solid lines are best fits to the experimental data. The nominal LNP composition is provided in Table 1. In the insets of panels B, C, and D the LNP schematics have the components colored according to their SLD values (i.e., deuterated components are black).

