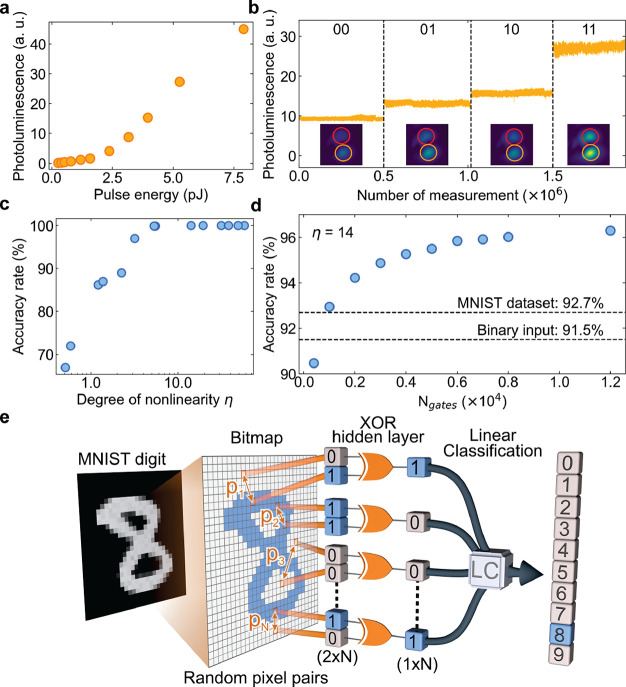
Figure 2.
Optoelectronic machine learning. (a) The nonlinear dependence of the total emission intensity from the condensation site on the energy of two input pulses. (b) Emission in the four input configurations demonstrates nonlinearity. Insets show typical real-space emission observed on a CCD camera for each realization. The same color scale is preserved for each panel. Image size is of ∼7 μm × 7 μm. (c) Accuracy of the XOR gate as a function of the useful degree of nonlinearity η. (d) Accuracy of the MNIST handwritten digit prediction versus the number of XOR gates. Dashed lines show the benchmarks of software linear classification for the full and binarized MNIST input. (e) Conceptual scheme of the network with a single hidden layer of XOR gates.

