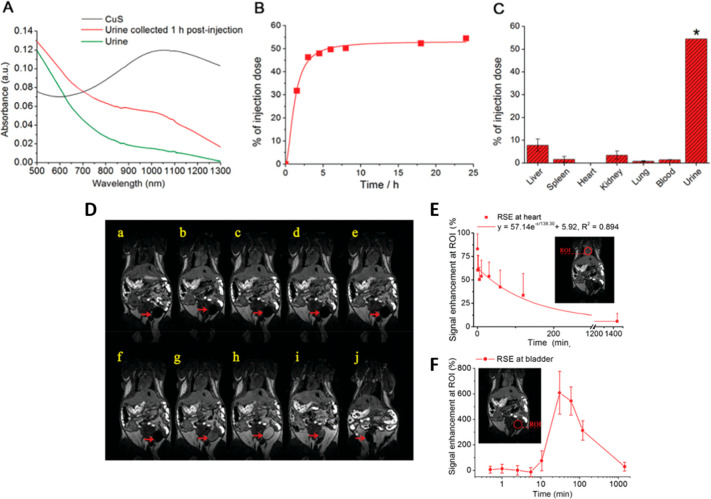
Figure 10.
Upper panels: Renal clearance and biodistribution studies of GSH-CuS NDs. (A) Absorption spectra of urine samples before and 1 h after the injection. (B) Amount of Cu excreted in urine. (C) Biodistribution of GSH-CuS NDs at 24 h post-injection. D) MR images of GSH-CuS NDs enhanced (from a to j: pre-injection and 30 s, 1 min, 2.5 min, 5.5 min, 10.5 min, 30.5 min, 1 h, 2 h, and 24 h post-injection signal enhancement in heart (B) and bladder (C) caused by GSH-CuS NDs. Reprinted with permission from ref (111). Copyright 2013 Royal Society of Chemistry.

