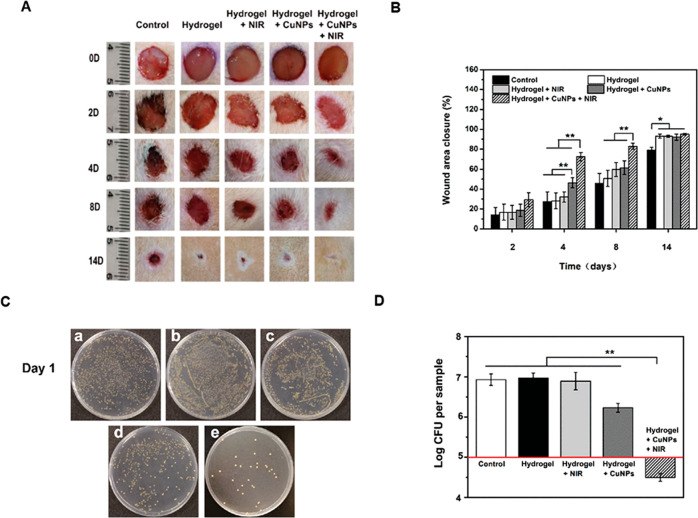
Figure 6.
(A) Steps of healing of infected wounds in mice on days 0, 2, 4, 8, and 14. (B) Wound area closure (%) at different times points. (C) Bacteria from the wound tissues on LB agar plates (a: control; b: hydrogel; c: hydrogel + laser; d: Cu-NP-embedded hydrogel; e: Cu-NP-embedded hydrogel + laser). (D) Log of total bacterial CFU on the LB agar plates. Reprinted with permission from ref (54). Copyright 2013 Royal Society of Chemistry.

