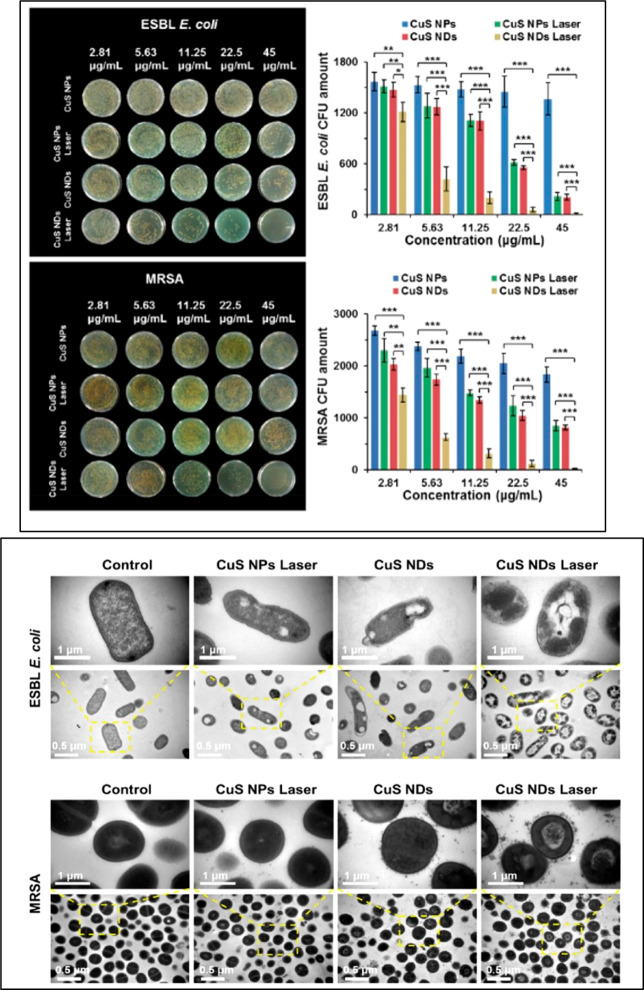
Figure 7.
Upper panel: Photos and relative survival rates of ESBL E. coli (up) and MRSA E. coli (down). In the graphs The amount of bacteria is reported vs the concentration of NPs. Down panel: TEM images of ESBL E. coli and MRSA for CuS NPs, CuS NDs with and without laser irradiation (2.5 W/cm2, 10 min). Reprinted with permission from ref (91). Copyright 2019 American Chemical Society, with Creative Commons Attribution (CC BY) license.

