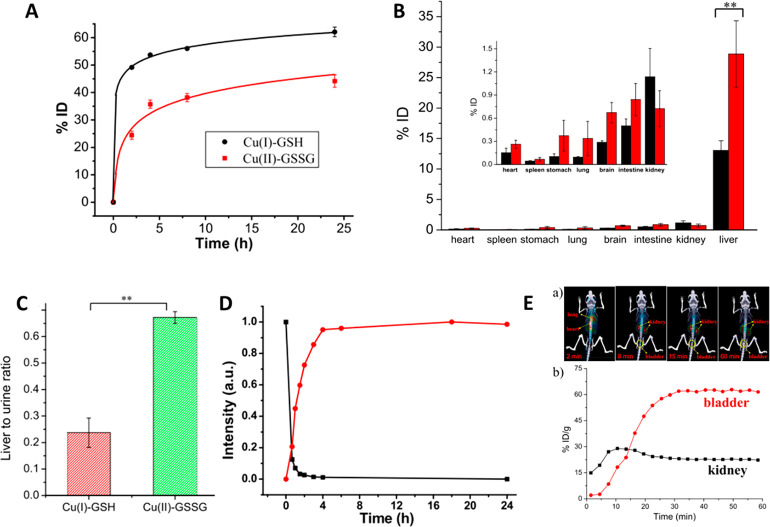
Figure 9.
(A) Copper in the urine of mice at different times post injection. (B) Biodistribution of Cu(I)-GSH and Cu(I) complex (Cu(II)-GSSG). (C) Liver to urine ratios of the two complexes at 24 h. (D) Fluorescence intensity of the complexes (black is Cu(I) complex, red the Cu(II) complex). (E) Time dependence of copper distribution in kidneys and bladder. Reprinted with permission from ref (109). Copyright 2017 The Authors, published open access by MDPI under Creative Commons Attribution (CC BY) license.

