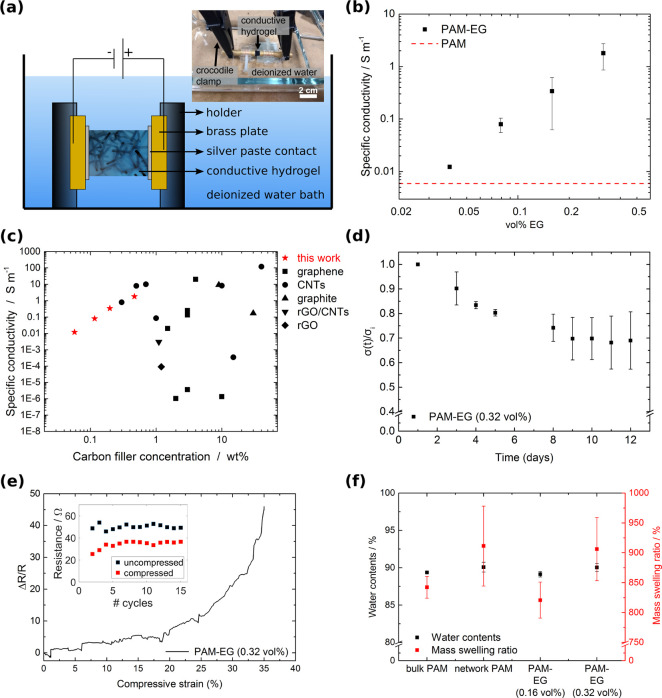
Figure 3.
Electrical conductivity of PAM-EG composites: (a) Schematic of the conductivity measurement setup. The sample was mounted with silver paste in a customized sample holder. The measurement took place in water to prevent drying of the hydrogel composites. (b) Specific conductivity of the PAM-EG composite as a function of EG concentration. Error bars represent standard deviation, N = 3. (c) Comparison of the conductivities of electrically conductive hydrogels based on carbon filler material. The red stars indicate the results for the PAM-EG composites from this work. The list of all electrically conductive hydrogels with corresponding references are shown in Table S1 in the Supporting Information. (d) Normalized conductivity (σ(t)/σ0) as a function of time. PAM-EG with 0.32 vol % measured over 12 days (N = 3). (e) Normalized change in resistance during cyclic compression of up to 35%. The inset shows the resistance values for the uncompressed and compressed state for 15 consecutive cycles. (f) Water content and mass swelling ratio of different samples.

