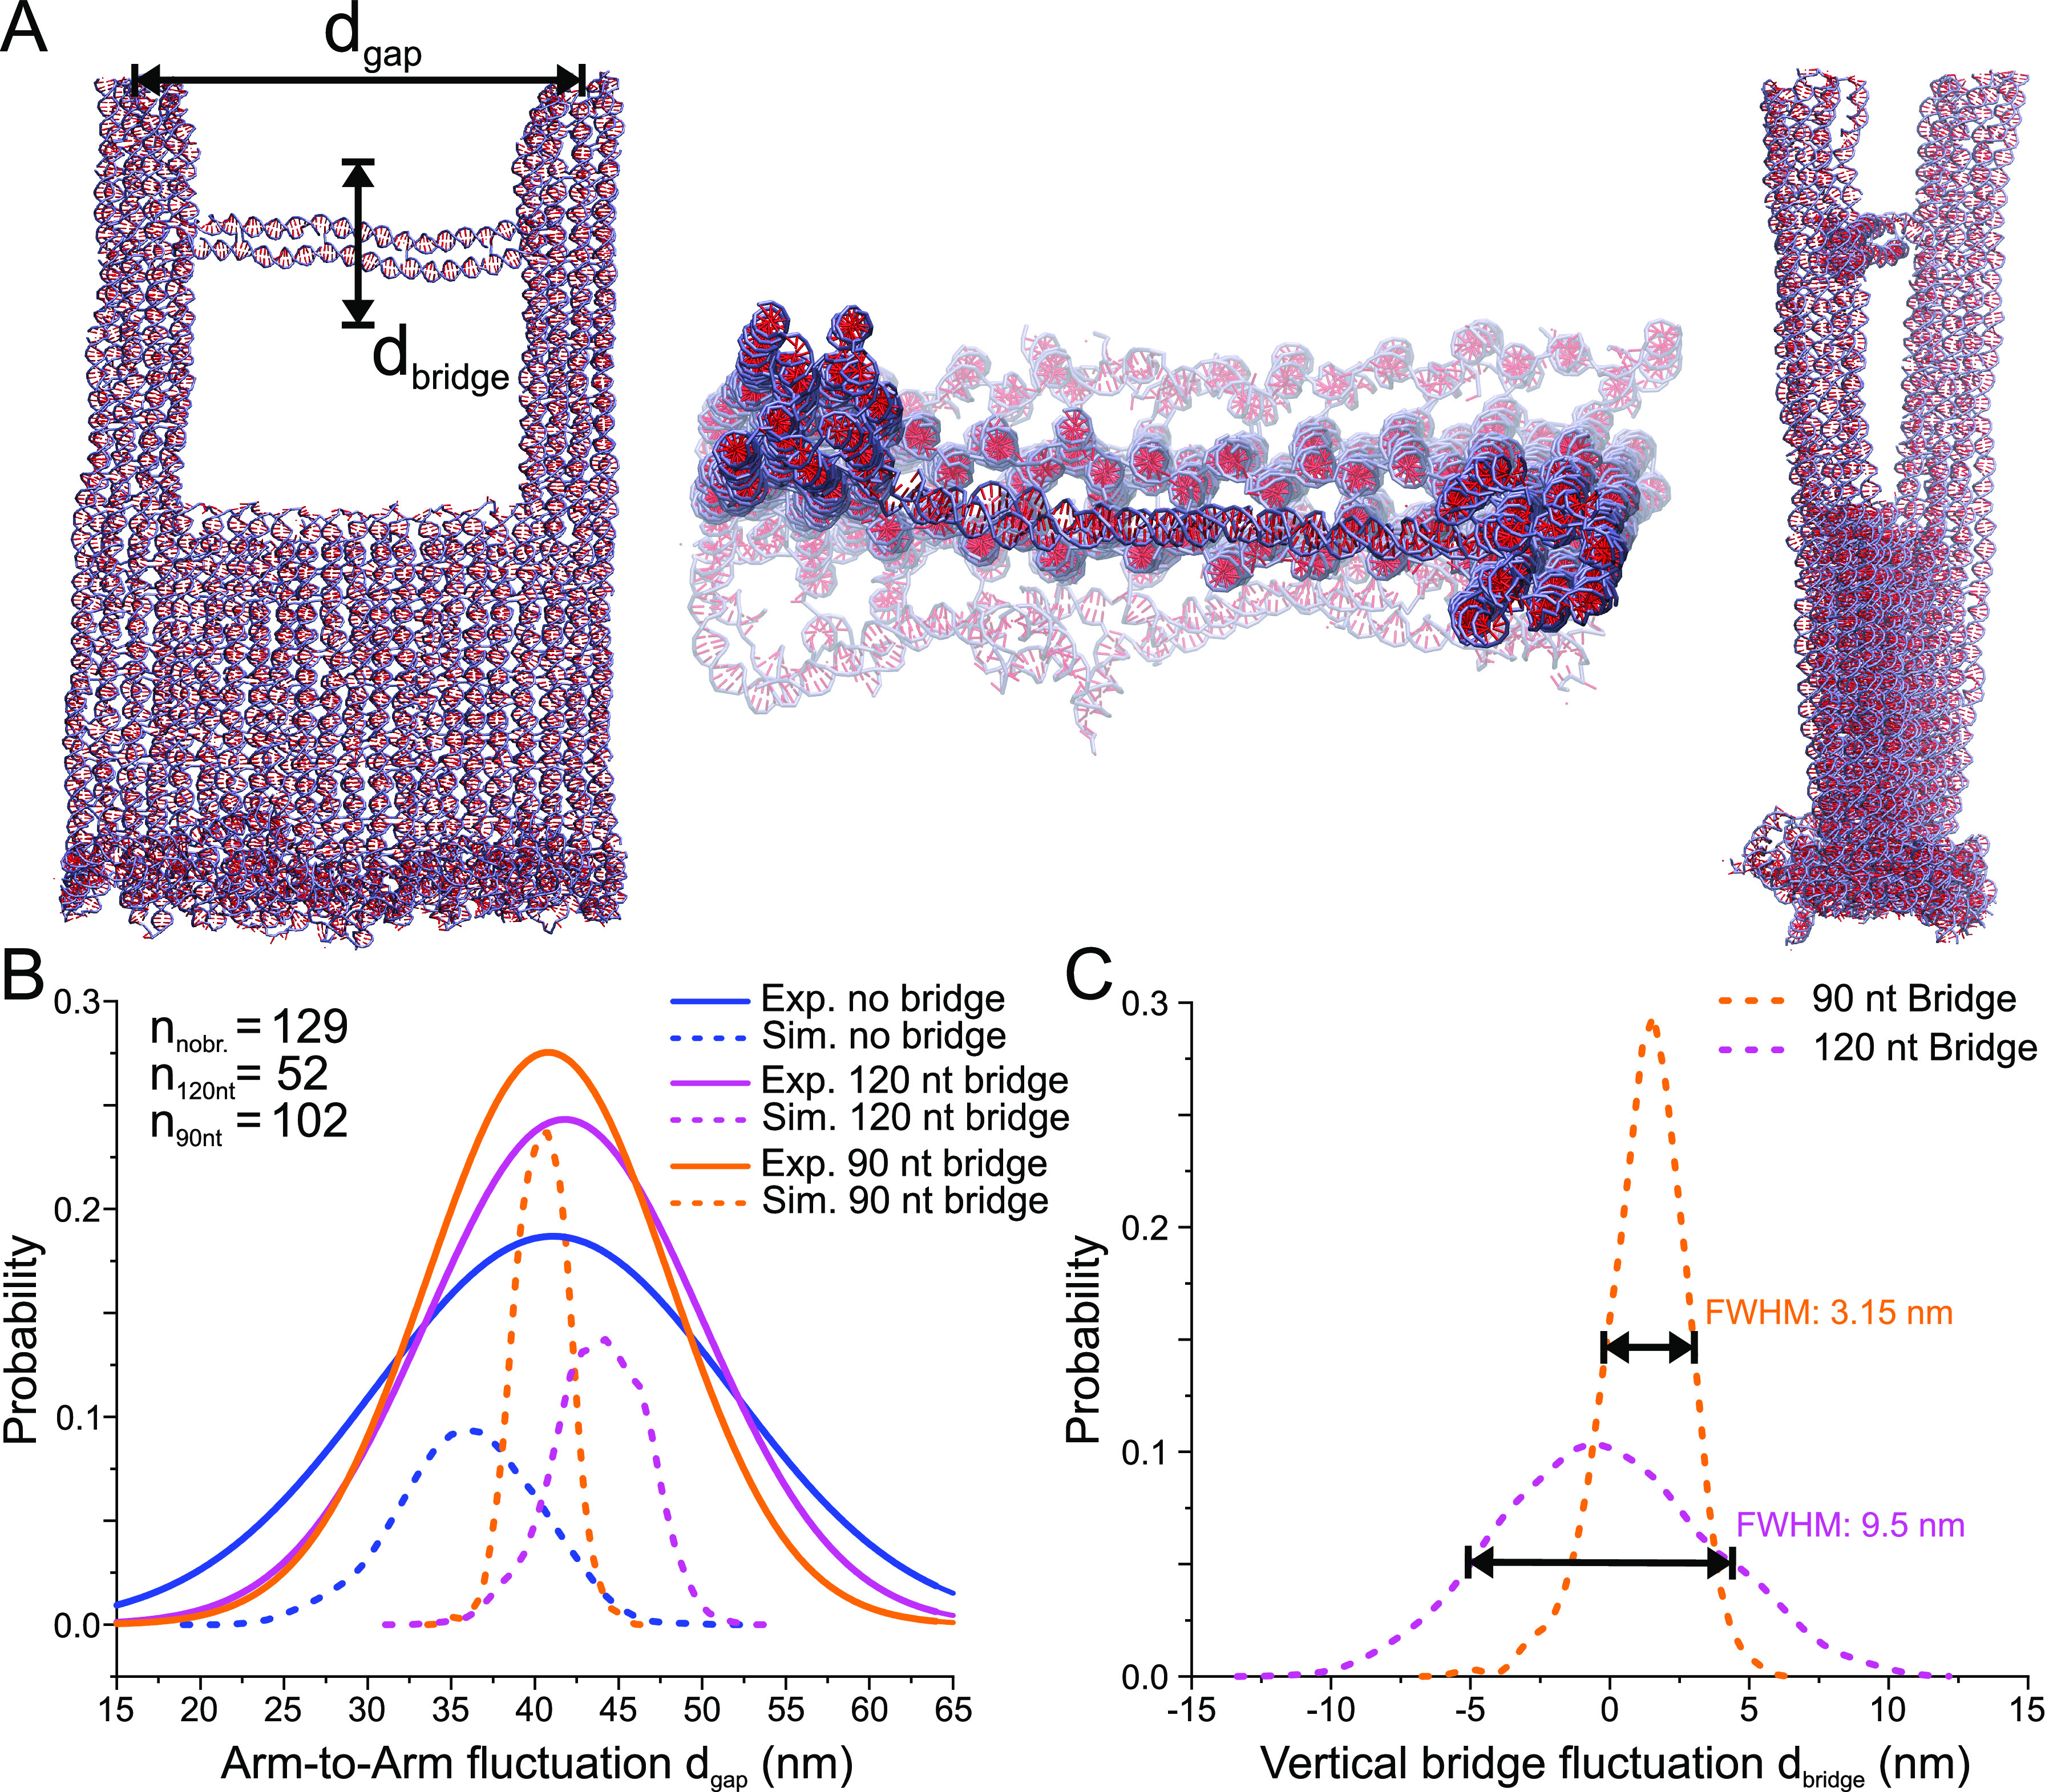
Figure 2.

Coarse-grained oxDNA model of the DNA origami nanofork. (A) Snapshots of two side views and one top-view of the nanofork with 90 nt DNA bridge as simulated using the oxDNA model. (B) Plot of the simulated probability distribution of distance between the tips of the two arms and comparison with experimental values obtained from AFM images (for no bridge and 90 nt and 120 nt bridges, the maxima are 41.13, 40.82, and 41.84 nm, respectively). The number of nanoforks analyzed by AFM is given in the left legend. (C) Plot of the simulated probability distribution of the flexibility of the center of a 90 nt and a 120 nt DNA bridge with respect to the straight bridge position, with the maxima at 1.56 nm and −0.6 nm, respectively.
