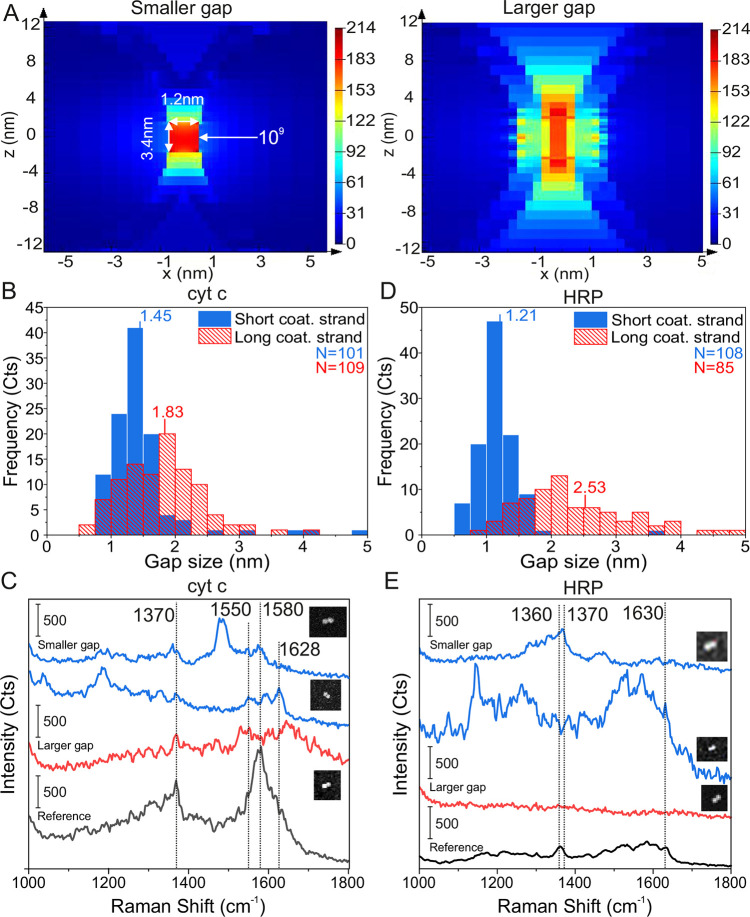
Figure 5.
Single-molecule SERS measurements of cyt c and HRP. (A) Field enhancement plots of the DONA Au dimers, when the gap size is 1.2 nm (smaller gap) and 3 nm (larger gap). (B) Distributions of the smaller and larger gap sizes determined from TEM images of cyt c with the average gap sizes of 1.45 and 1.83 nm, respectively. The number (N) of counted dimers was 101 and 109 for the smaller and larger gaps, respectively. (C) SM SERS spectra of cyt c using Au DONA structures and 633 nm excitation. (D) Distributions of the smaller and larger gap sizes determined from TEM images of HRP with the average gap sizes of 1.21 and 2.53 nm. The number (N) of counted dimers was 108 and 95 for the small and large gaps, respectively. (E) SM SERS spectra of HRP using Au DONA structures and 633 nm excitation. The insets in (C) and (E) show SEM images of the specific DONAs, from which the SM SERS spectra have been obtained. The sizes of the SEM images are from top to bottom 360 × 280 nm, 360 × 420 nm, and 300 × 360 nm and 240 × 240 nm, 360 × 420 nm, and 300 × 300 nm, respectively.

