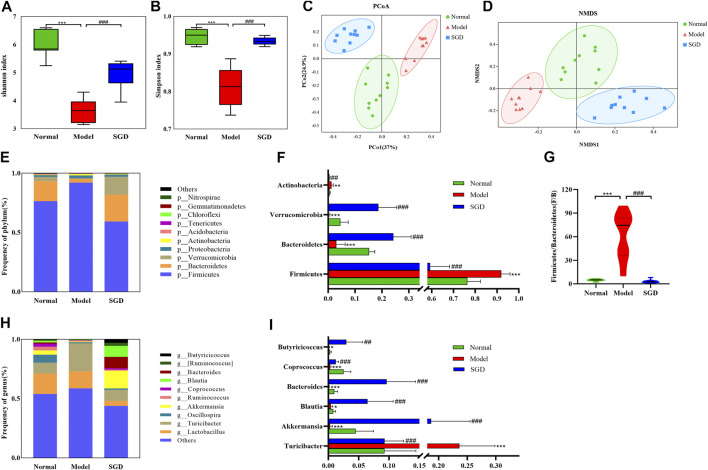
FIGURE 3.
SGD treatment modulated the gut microbiota composition in PCOS rats. Shannon (A) and Simpson (B) diversity index. PCoA (C) and NMDS (D) plot of intestinal microbiota based on OTU level. (E) Column diagram of community composition at phylum level. (F) The relative abundances of Firmicutes, Bacteroides, Verrucomicrobia, and Actinobacteria. (G) Firmicutes/Bacteroides ratio. (H) Column diagram of community composition at genus level. (I) The relative abundances of Turicibacter, Akkermansia, Blautia, Bacteroides, Coprococcus and Butyricicoccus in three groups.

