Figure 1.

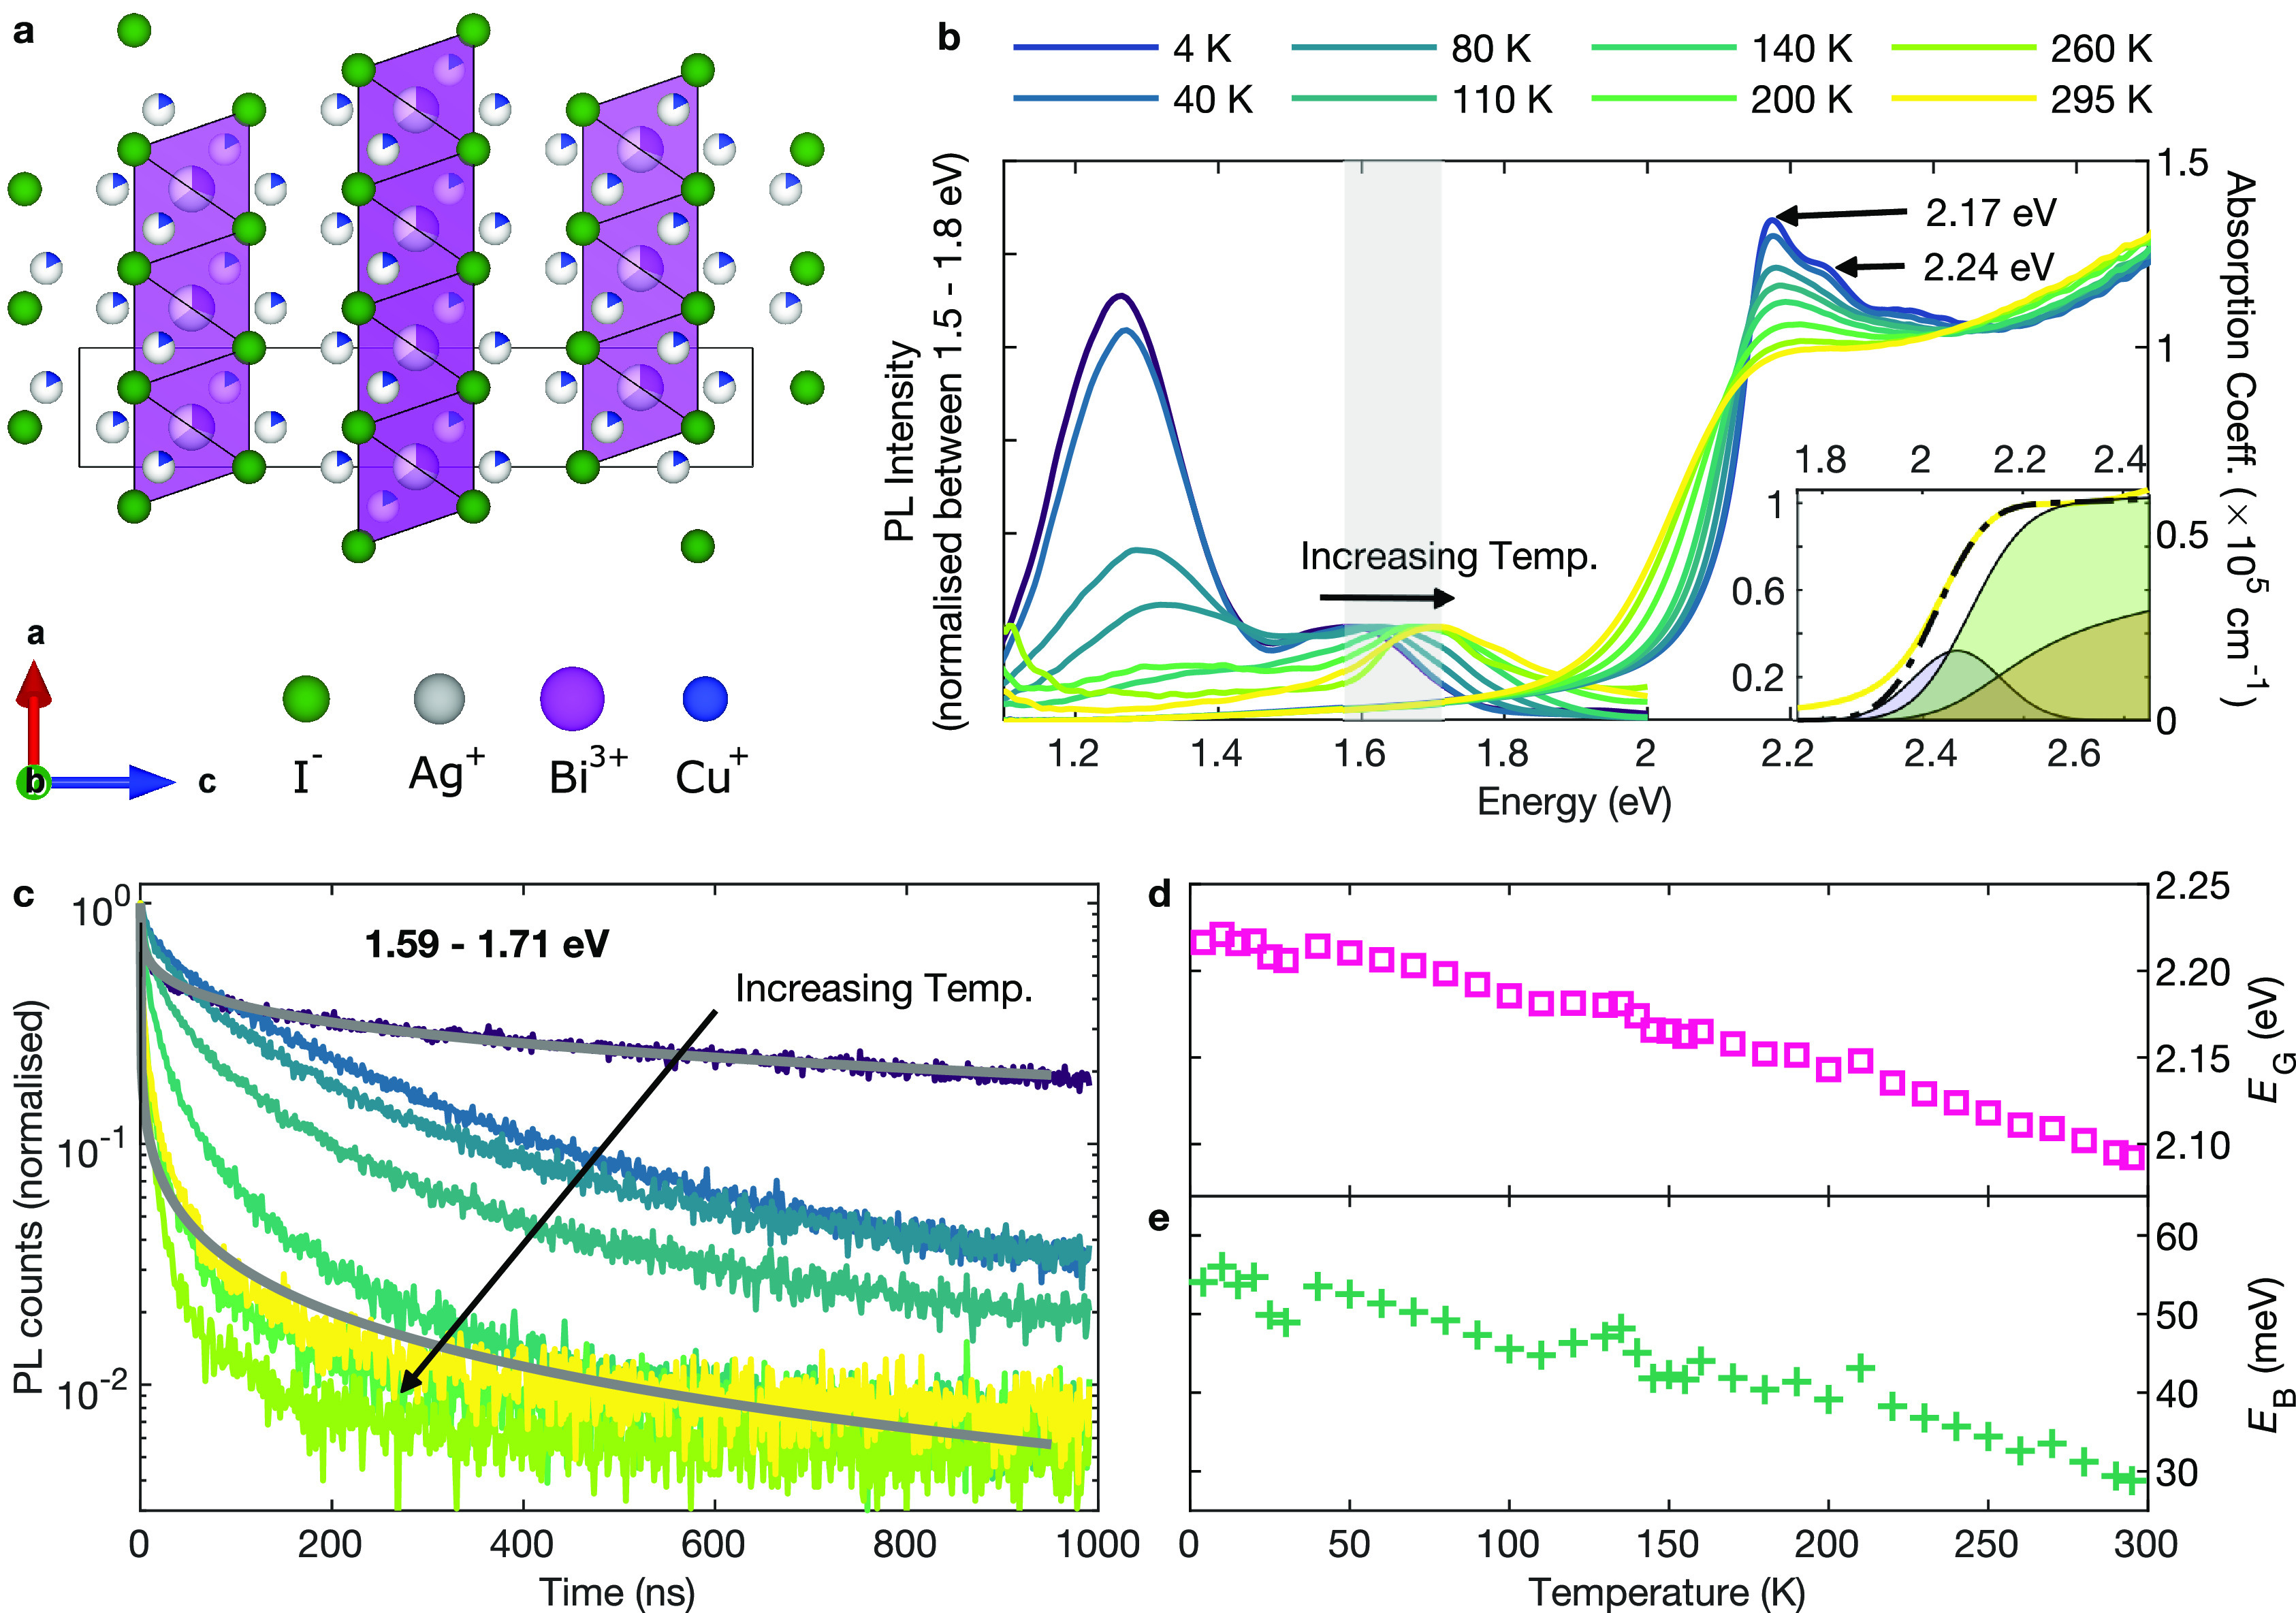
(a) Crystal structure of Cu2AgBiI6, with the edge-sharing octahedral layers highlighted in purple. The partial occupancy of the Ag+, Bi3+ and Cu+ sites is shown by the fractional filling of the circles at each ionic site. (b) Temperature-dependent photoluminescence and UV–visible absorption measurements of Cu2AgBiI6 thin films between 4–295 K. The PL peak blue-shifts with increasing temperature. The shaded region between 1.59–1.71 eV indicates the high-energy region from which TCSPC measurements were taken (shown in (c)) and from which peak counts were measured (shown in Figure S3 (c)). The inset shows the fit to the spectrum at 295 K using Elliott’s theory (black dashed line),60 with the shaded areas indicating the excitonic (blue) and continuum contributions without (brown) and with (green) Coulombic enhancement. See the Supporting Information for fits across more temperatures and the extracted broadening parameter Γ. (c) Time-resolved PL decays measured using TCSPC at a fluence of 200 nJ cm–2. The decays are very heterogeneous (nonexponential) at high temperatures, and become much longer-lived at low temperatures. The gray solid lines are fits to a stretched exponential at 4 and 295 K. See the Supporting Information for fits to all of the transients and extracted parameters. (d) Value of the band gap energy EG extracted at each temperature using the Elliott fits. (e) Value of the exciton binding energy EB extracted at each temperature using the Elliott fits.
