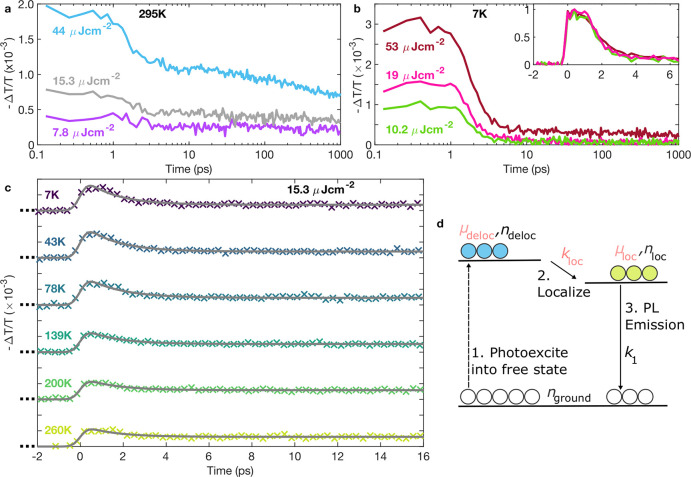
Figure 2.
Fractional change in the transmitted THz-field amplitude for Cu2AgBiI6, proportional to the photoinduced THz conductivity, plotted as a function of time after excitation. Such OPTP transients are shown for a range of different excitation fluences for (a) 295 K and (b) 7 K. The inset in (b) shows the normalized traces at 7 K over the first 6 ps, indicating a lack of fluence dependence to the charge-carrier dynamics. (c) Early time temperature-dependent OPTP data measured at a fluence of 15.3 μJ cm–2 and fitted with a two-level mobility model, with the fits shown as gray solid lines. The two-level mobility model is explained schematically in (d), with fixed parameters shown in black and parameters that are fitted and extracted from the model in pink. The dotted line indicates the initial photoexcitation of charges, in our case due to pulsed laser excitation. See the main text and Supporting Information for further discussion of the model and parameter values extracted.

