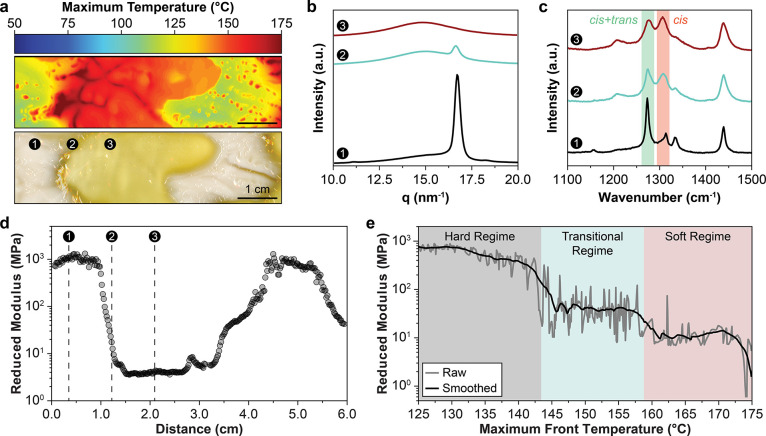
Figure 4.
Spontaneous patterning with cyclooctadiene. (a) Maximum temperature profile during free-surface FROMP of 1,5-cyclooctadiene (top) and optical image (bottom) of the resulting pattern showing crystalline (white) and amorphous (yellow) domains. The numbered markers represent measurement locations in subsequent characterization. (b) WAXS profiles obtained at the locations indicated in a. (c) Raman spectra obtained at the locations indicated in a. (d) Reduced modulus as a function of distance from the initiation point obtained via nanoindentation. The indentation profile follows the same trajectory as the numbered locations in a. (e) Reduced modulus as a function of maximum front temperature obtained through spatial correlation of nanoindentation scans and thermal profiles. The reported raw data (gray) represents the average of spatial correlations for the nanoindentation curves shown in d and Figure S8. The smoothed curve (black) was obtained from adjacent averaging 100 points of raw data (gray).

