Figure 4.
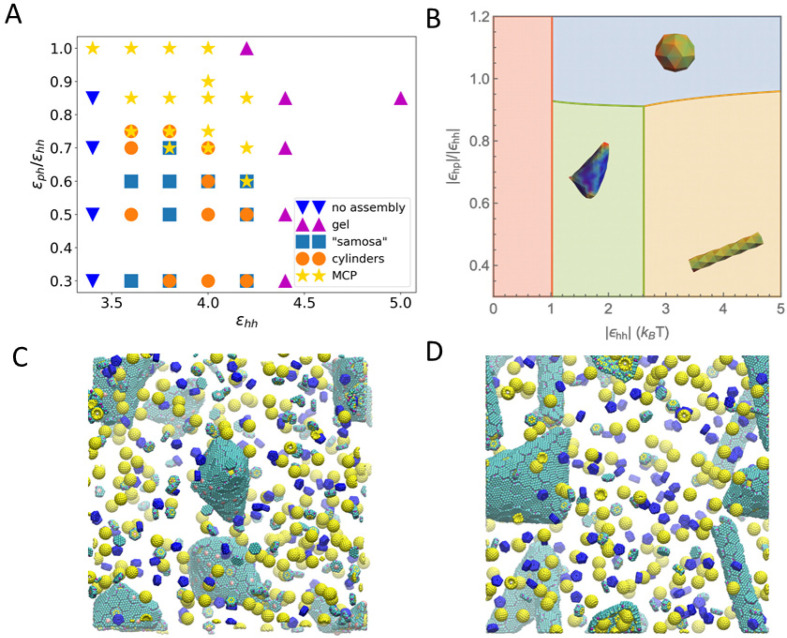
(A) Phase diagram of assembled shapes from CG MD simulations. The axes are the ε parameters defined in eq 1. The simulation box is constructed from a unit of 4 μBC–H, 2 μBC-T, 2 enzymes, and 1 μBC–P, replicated 5 times in x, y, and z directions. (B) Phase diagram from thermodynamics analysis (see parameters used in Table S5 in the SI). When the hexamers’ binding energy is weak, there is no assembly (red region). With stronger hexamer–hexamer interaction εhh, MCP, cylindrical, and samosa shaped shells are formed, corresponding to the blue, yellow, and green regions, respectively. (C, D) Snapshots of CG simulations (the hexamers, pentamers, and cargo are in green, blue, and yellow, respectively; a red dot is marked on the center of BMC-T to distinguish them from BMC-H). (C) The “samosa” shape (εhh = 3.8, εph = 1.9) is a quasiclosed surface without BMC-P proteins. They are different from MCPs in that they have no pentamers, and the vertices are sharp cones with a hole or defect at the tip. An example of a 4-fold defect is shown in the center. (D) Coexistence of cylinders and “samosas” at (εhh = 3.8, εph = 2.28).

