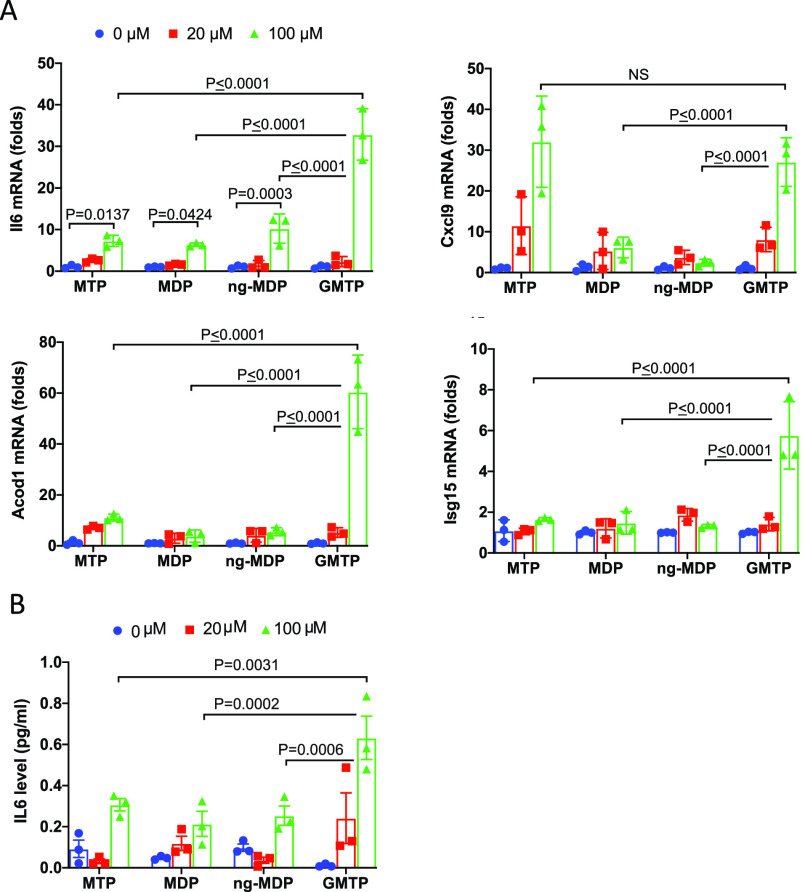
Figure 5.
Gene expression analysis of cluster 1 genes and cytokine analysis confirm GMTP’s reactivity. (A) Gene expression and statistical analysis of qRT-PCR data for Il6, Acod1, Cxcl9, Lcn2, and Isg15 in BMDMs treated with 0, 20, or 100 μM 3, 4, or 5 or control (water) for 18 h. Total RNA was harvested, and the expression levels of selected genes were analyzed by qRT-PCR. Data were analyzed using one-way ANOVA and the ordinary ANOVA test. Error bars represent mean ± SD. (B) IL6 expression in the supernatant of BMDMs from (A) after 18 h of stimulation with the indicated peptidoglycan fragments and concentrations. Data were analyzed using one-way ANOVA and the ordinary ANOVA test. Error bars represent mean ± SD.

