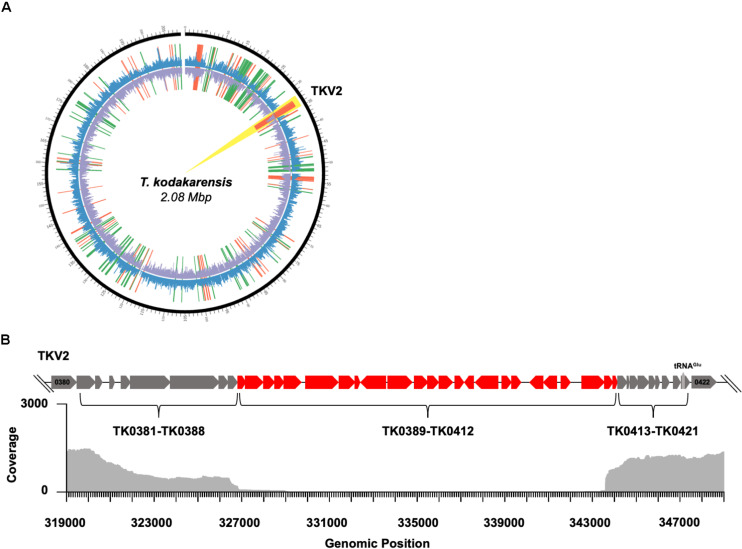
FIGURE 3.
Disruption of 3-dimensional chromatin structure results in genome instability in T. kodakarensis. (A) A circos plot comparing TS620 to TS600. The outermost black circle represents genomic position. The outer coverage plot (blue) represents Fragments Per Kilobase of transcript per Million mapped reads (FPKM) for TS620. The inner coverage plot (purple) represents FPKM for TS600. Notably, nearly zero reads mapped to TKVR2 in TS620 (highlighted in yellow). Red lines represent fragments enriched in TS600 while green lines represent fragments enriched in TS620. (B) A loci diagram of the annotated T. kodakarensis viral region 2 (TKVR2: TK0381-TK0421) that highlights the observed region of excision (∼TK0389 – ∼TK0412) superimposed over a genome alignment plot derived from PacBio long read sequencing of TS620.

