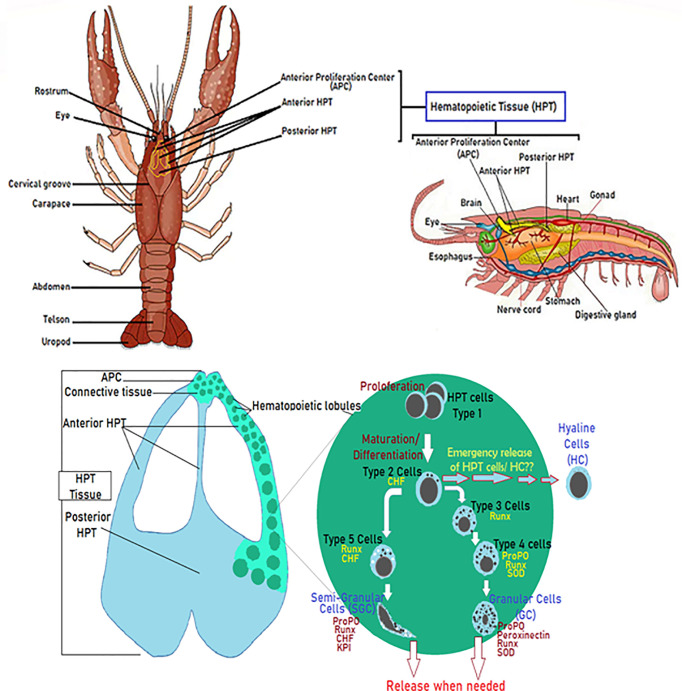
Figure 2.
Diagram of the hematopoietic tissue (HPT) illustrating the hematopoiesis’ mechanistic steps. Schematic localization and presentation of the different parts of the HPT and the hematopoietic lobules illustrating the different phases of hemocyte production and how different cell types (Type I-V) acquire their specific molecular markers (47, 53, 75, 80–84).

