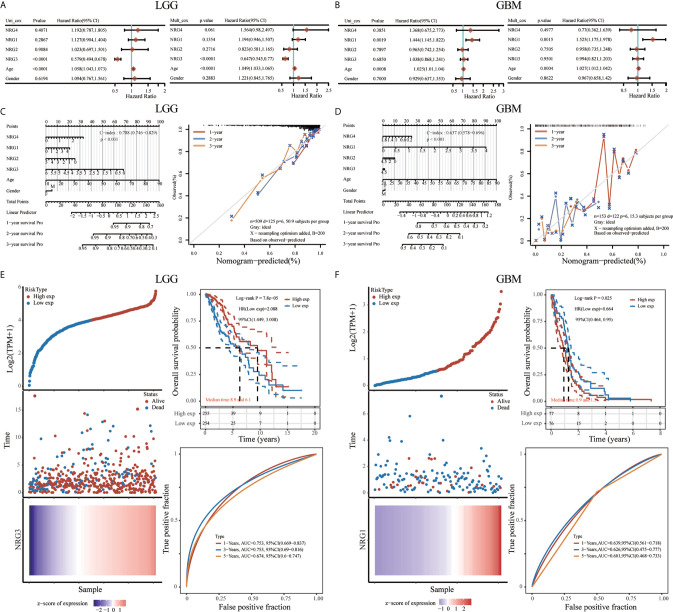
Figure 11.
Prognostic value of NRGs in LGG and GBM. Univariate and multivariate Cox regression of NRG1-4 in LGG (A) and GBM (B). Nomogram to predict the 1, 2 and 3-year overall survival of patients with LGG (C) and GBM (D). The dashed diagonal line represents the ideal nomogram, and the blue, red and orange lines represent the 1, 2 and 3-year observed nomograms, respectively. Risk model and prognostic analysis of NRG3 in LGG (E), and NRG1 in GBM (F), respectively. The prognostic risk model shows the Risk type (top left), patient status (middle left) and mRNA expression heatmap (bottom left), and Kaplan–Meier curves of OS (top right) and time-dependent ROC (bottom right) for NRG3 in LGG (E) and NRG1 in GBM (F).

