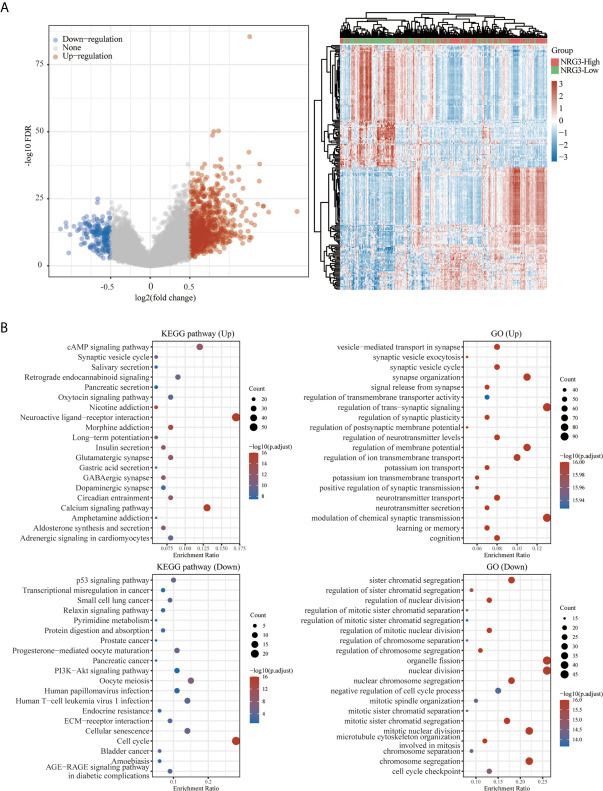
Figure 12.
Functional enrichment for gene set associated with high/low expression of NRG3 in patients with LGG. Differentially expressed genes for high expression of NRG3 vs low expression of NRG3 in LGG were shown in the volcano plot (A), with blue dots representing significantly down-regulated genes and orange dots representing significantly up-regulated genes in high expression of NRG3 in LGG, and heatmap exhibits the expression level. Enrichment analysis for KEGG pathway and GO term of down-regulated genes and up-regulated genes in high expression of NRG3 in LGG (B).

