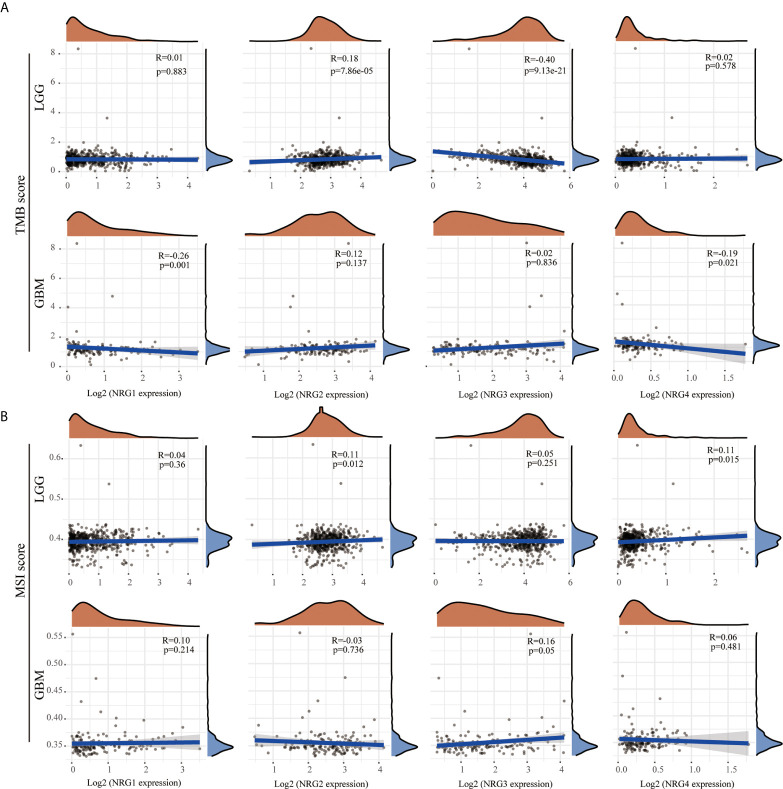
Figure 6.
Correlations between NRGs expression and TMB/MSI in LGG and GBM. Correlation analysis of NRG1-4 expression and TMB (A) /MSI (B) in LGG and GBM. The horizontal axis represents the expression distribution of NRG1-4, and the ordinate represents the expression distribution of TMB/MSI score. The density curve on the right represents the distribution trend of TMB/MSI score; the upper density curve represents the distribution trend of NRG1-4. Spearman’s correlation analysis was used to describe the correlation. P < 0.05 was considered statistically significant.

