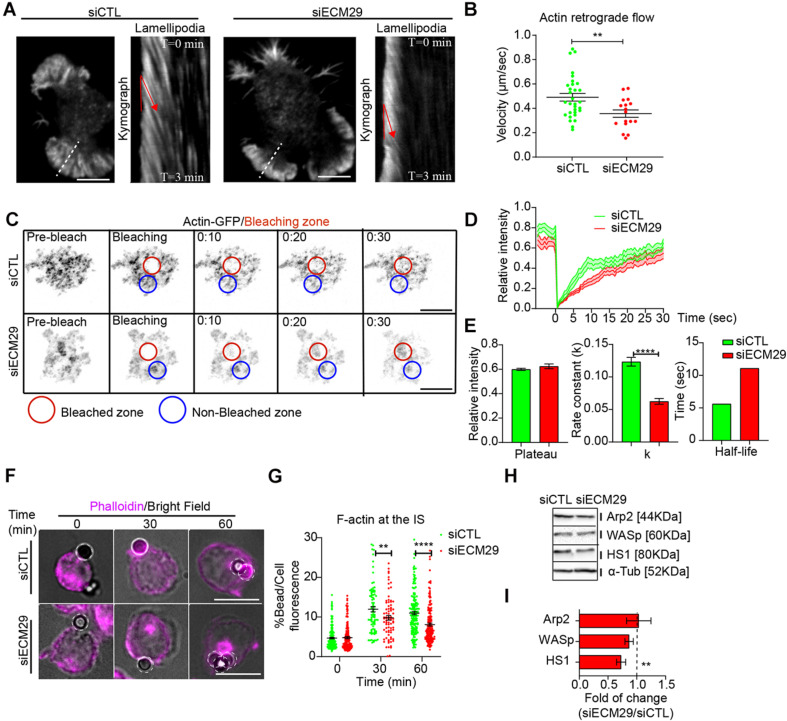
FIGURE 4.
Ecm29 silencing reduces actin dynamics and accumulation at the IS: (A) Representative TIRFM images of control (siCTL) and Ecm29-silenced (siECM29) B cells after 30 min of activation and their respective kymographs of lamellipodia (white dashed line). Red lines represent the actin retrograde flow angle. (B) Quantification of actin retrograde flow in (A). N = 17. (C) Time-lapse FRAP-TIRFM images of control and Ecm29-silenced B cells expressing Actin-GFP (grayscale) after 30 min of activation. Red and blue circles represent the bleached and non-bleached zone, respectively. (D,E) Quantification of Fluorescence Recovery After Photobleaching of Actin-GFP, and associated parameters (plateau, k, and half-life). N = 15. (F) Representative epifluorescence images of control and Ecm29-silenced B cells activated with antigen-coated beads for different time points, labeled for F-actin (Phalloidin) are shown. (G) Quantification of F-actin accumulation at the bead in F. N > 3. Cells > 80. (H) Representative immunoblot of control and Ecm29-silenced B cells. Arp2, WASp, HS1, and α-Tub are shown. (I) Quantification of protein levels in (E). N > 4. **p < 0.01. ****p < 0.0001. A Mann–Whitney was performed. Mean with SEMs and individual experiments (points) (A,G), and boxes with SEM (I) are shown. Scale bar = 10 μm.

