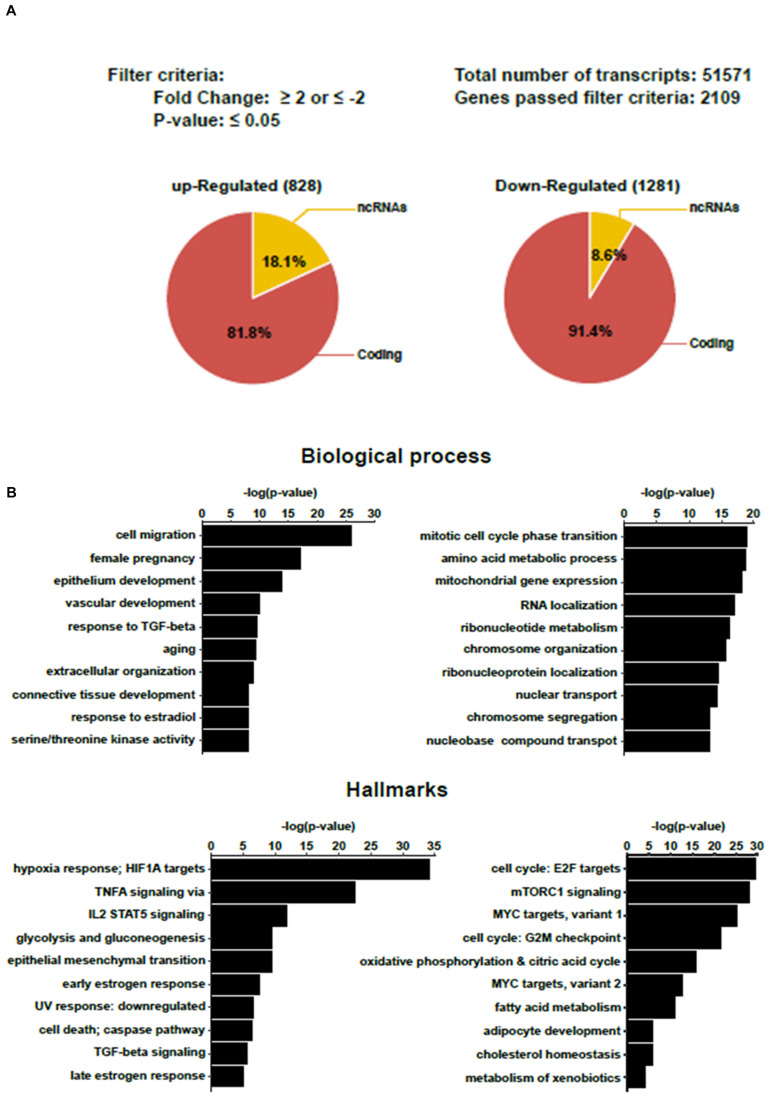
FIGURE 2.
Transcriptomic analysis of BeWo cells after 72 h treatment with forskolin. (A) Summary of transcriptomic analysis. Genes with a fold change (FC) either ≤-2 or ≥2, and P ≤ 0.05 were considered differentially expressed in the BeWo cells treated with forskolin (BeWo-FSK) relative to the untreated cells (BeWo-CO). (B) Over Representation Analyis (ORA) showing principal Biological processes and Hallmarks enriched by the up-regulated (left) and down-regulated (right) DEGs in the BeWo-FSK compared to the BeWo-CO.

