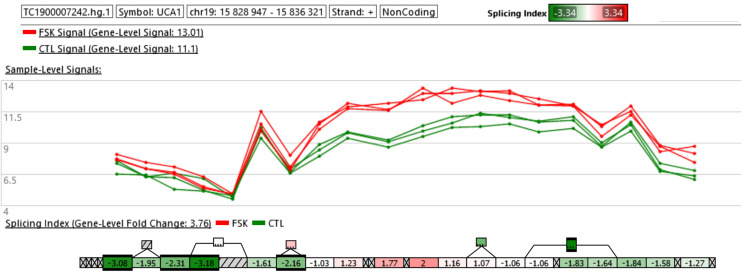
FIGURE 5.
Exon level analysis of UCA1. The microarray ClariomD provides information on the local fluorescence level of a series of probe and allows to calculate a local splicing index, comparing BeWo cells treated with FSK vs. BeWo cells treated by the DMSO as a vehicle. Isoforms lacking the first portion of the full transcript are more strongly expressed in the BeWo-FSK comparatively to the BeWo-CO.

