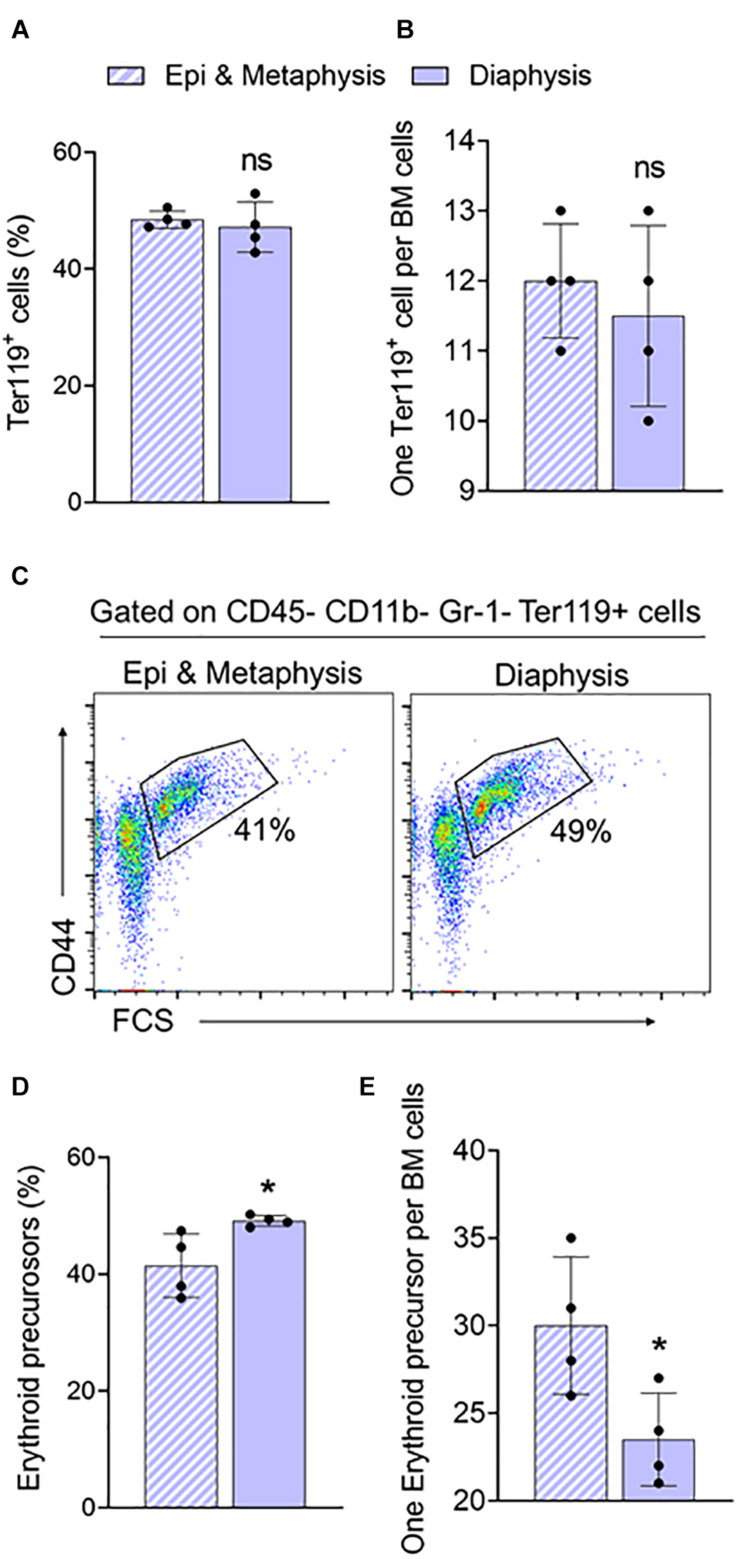
FIGURE 3.
Femur epiphysis and metaphysis have lower erythroid precursors compared to the diaphysis. (A) Percentage of Ter119+ cells in epi and metaphysis, and diaphysis of the femur. (B) Ratio of Ter119+ cells to BM cells. (C) Representative FACS plots showing expression of BM Ter119+ erythroid precursors from epi and metaphysis and diaphysis based on CD44 expression and size (FSC-forward scatter). The gated region shows percentage of erythroid precursor cells. (D) Erythroid precursors within Ter119+ cells from epi and metaphysis and diaphysis. (E) Ratio of erythroid precursors to BM cells. n = 4 mice in two independent experiments. Data represented as mean ± SD; Statistical significance was assessed using an unpaired t test. *p < 0.05.

