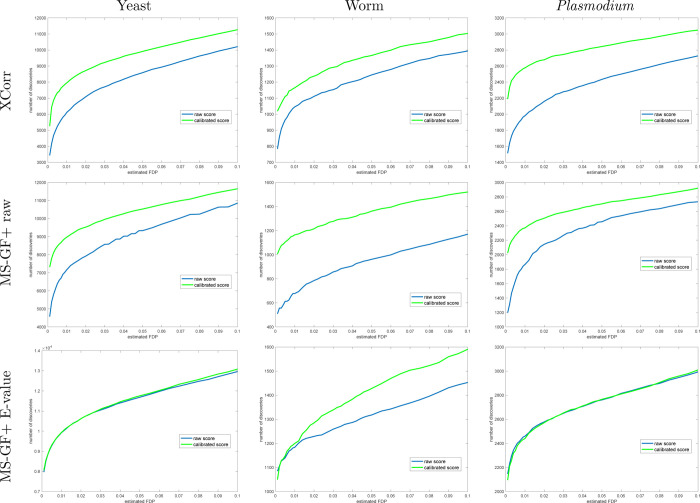
Figure 3.
Calibrating a noncalibrated score on average yields more discoveries (TDC). Each panel plots the median number of discoveries as a function of FDR threshold using TDC applied to the raw and calibrated scores (the median is with respect to 1000 applications, each using a single independently drawn decoy set). Calibration substantially increases the number of TDC discoveries when using the noncalibrated MS-GF+ and Xcorr scores. MS-GF+ E-value is designed as a calibrated score; hence, calibration adds little to the yeast and Plasmodium data sets. Surprisingly, though, calibration makes a substantial impact even on the E-value in the worm data set.

