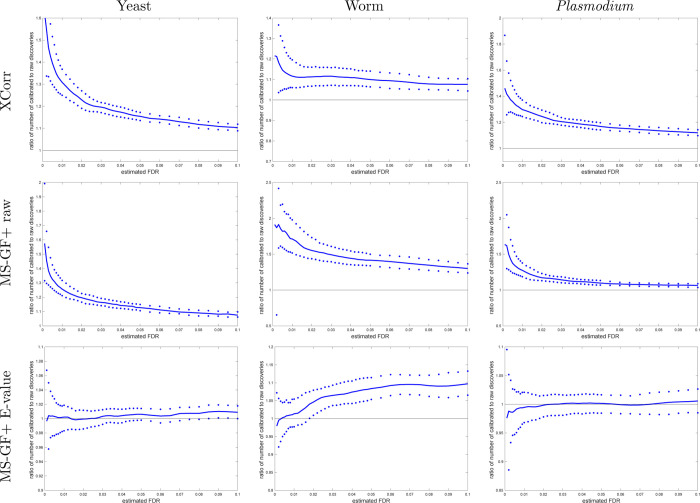
Figure 4.
Calibrating a noncalibrated score mostly yields more discoveries (TDC). Each panel plots, as a function of estimated FDR, the ratio of the number of TDC discoveries at FDR ≤ 0.1 when using the calibrated score (numerator) versus the number of discoveries at the same FDR when using the raw score (denominator). The solid line represents the median ratio (with respect to 1000 ratios, each comparing the raw vs calibrated TDC discoveries using a single independently drawn decoy set), while the 0.95 and 0.05 quantiles of the ratios are represented as dots. For small FDR values, the calibrated score yields considerably more discoveries than the uncalibrated score (MS-GF+ and Xcorr).

