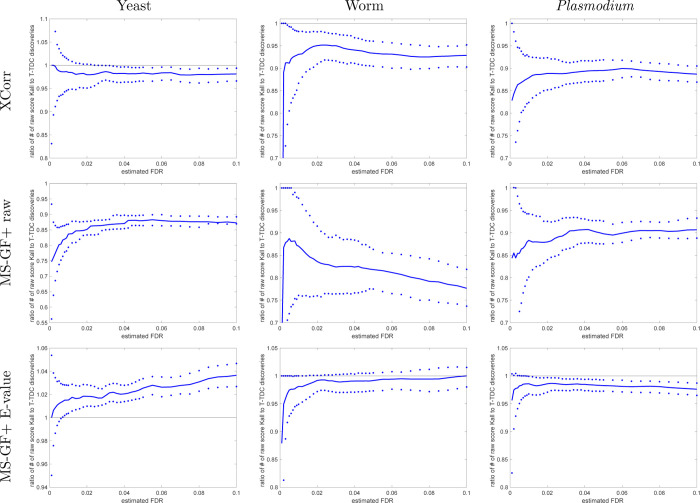
Figure 7.
With noncalibrated scores, STDS-PIT is more conservative than TDC. The ratio of the number of STDS-PIT (Käll) discoveries to TDC discoveries at FDR ≤ 0.1 when using the raw score. The median ratio (with respect to 1000 independently drawn decoys) in solid line is flanked by the 0.95 and 0.05 quantiles of the ratios. Results are for raw scores, but keep in mind that MS-GF+ E-value is partially calibrated even in its “raw” form, so the ratio of STDS-PIT to TDC discoveries fluctuates above and below 1.

