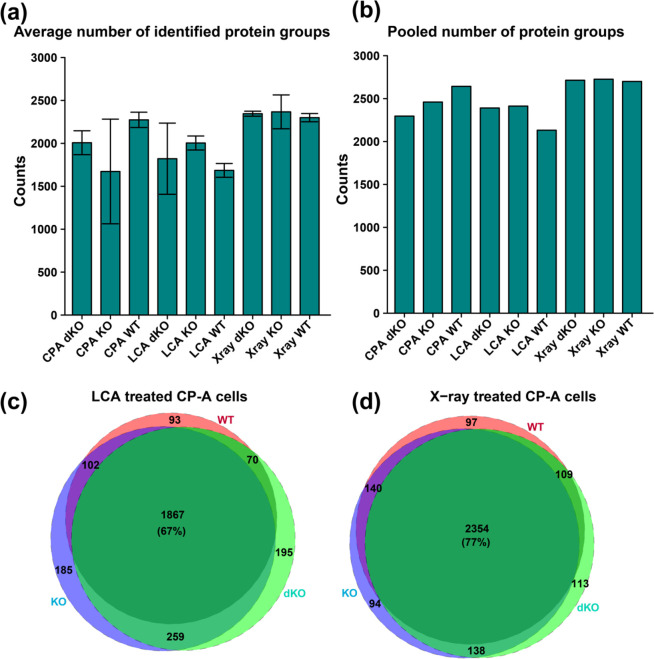
Figure 1.
Barplots and Venn diagram plots respectively showing the number of identified protein groups and overlap for CP-A WT, CP-A KO, and CP-A dKO samples of ∼200 cells. (a) Average numbers of identified protein groups with each bar representing the mean and standard deviation (error bars) of replicates from individual sample type. (b) Total numbers of identified protein groups from three replicates for each sample type. (c) A 67% overlap of the identified proteins for samples treated with LCA. (d) Samples treated with X-ray shows a 77% overlap for the identified protein groups.

