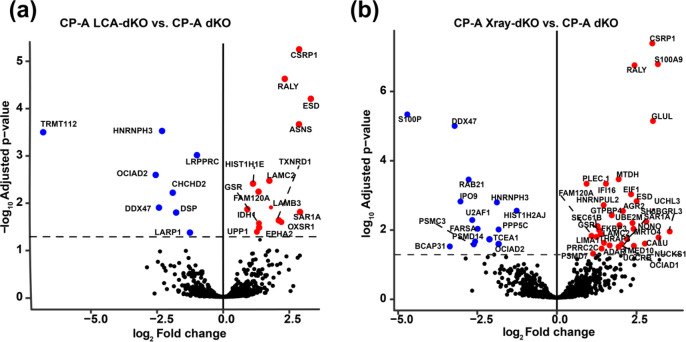
Figure 4.
Volcano plots illustrating the fold difference in the expression levels of proteins in (a) CP-A LCA-dKO vs CP-A dKO and (b) CP-A X-ray-dKO vs CP-A dKO. The horizontal coordinate represents the log2 fold change difference, while the vertical coordinate represents the −log10p-value. Black color indicates proteins with nonsignificant changes in abundance, blue color represents significantly downregulated proteins, and red color represents significantly upregulated proteins.

