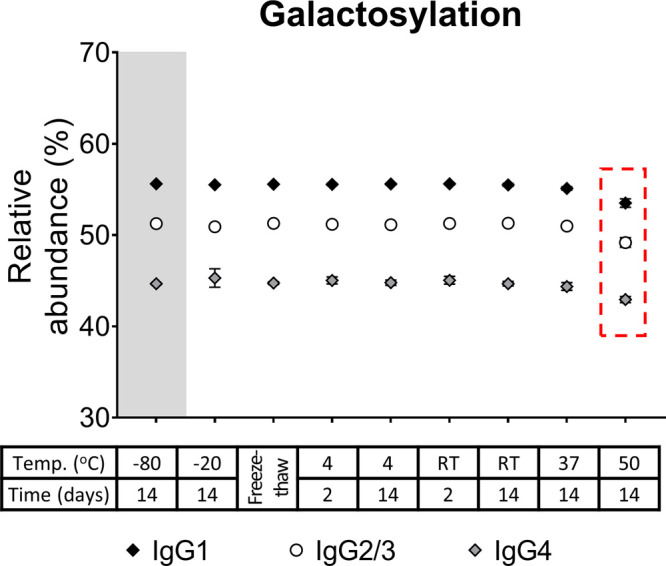
Figure 3.

IgG galactosylation of the three subclasses (IgG1, IgG2/3, and IgG4) from the serum of donor 1 (mean, SD, N = 4). All IgG1 findings were also observed for the other subclasses, exemplified for serum galactosylation of donor 1 here. The box highlights changes corresponding to p-values = 1 × 10⁻⁴, 2 × 10⁻⁴, and 6 × 10⁻⁵ for IgG1, IgG2/3, and IgG4, respectively. RT: room temperature.
