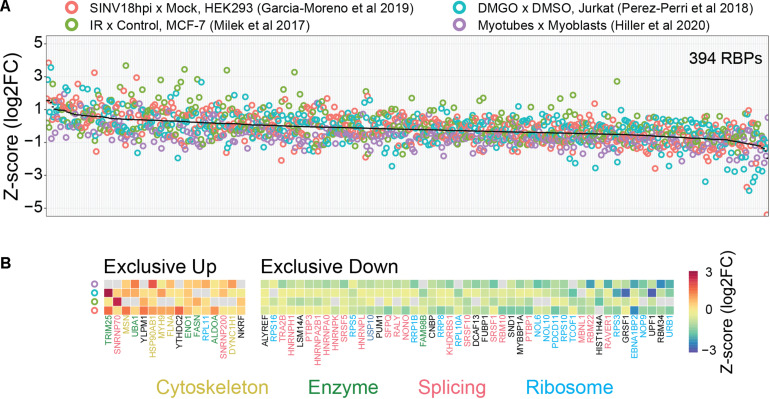
FIGURE 2.
Possible link between baseline RBP occupancy and observed changes in comparative RIC experiments. We used published data from four different cellular systems and perturbations [HEK293 cells infected with Sindbis virus (SINV), Infrared (IR) radiated MCF-7 cells, DMGO treated Jurkat cells, and differentiated myoblasts (myotubes)]. (A) Intra-experimentally z-scored log2 fold changes for 394 RBPs quantified in at least three experiments. Proteins were ranked by their mean fold change (black line). (B) RBPs exclusively up- or down-regulated in all experiments. Protein function was annotated manually. “Cytoskeleton” includes cytoskeleton dynamics-related proteins (yellow), “Enzymes” includes metabolic enzymes and protein modifiers (green), “Splicing” includes spliceosome components and splicing-related RBPs (red), “Ribosome” includes both core ribosome components and ribosome biogenesis-related factors (light-blue). We note that “moonlighting” RBPs (Cytoskeleton and Enzymes) and “core” RBPs (Splicing and Ribosome) tend to be up- and down-regulated, respectively. See text for more details.

