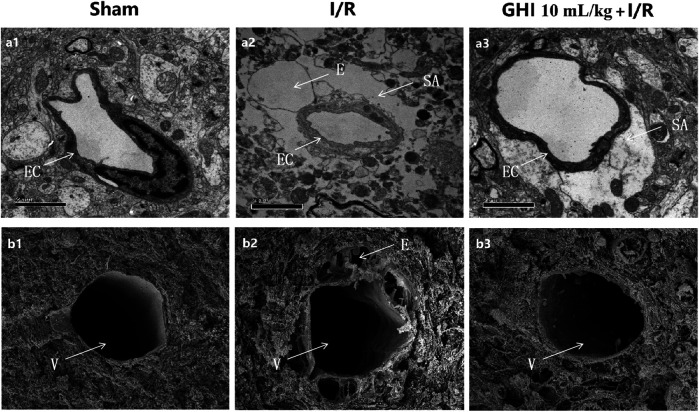
FIGURE 4.
Ultrastructure of microvessels in the cerebral cortex. The transmission electron micrographs of the cerebral cortex are displayed in a1–a3; the scanning electron micrographs of the cerebral cortex are displayed in b1–b3. a1, b1: Sham group; a2, b2: I/R group; a3, b3: GHI 10 ml/kg + I/R group. E: perivascular edema; EC: endothelial cell; SA: swelling astroglial process; and V: venules (bar = 50 μm).

