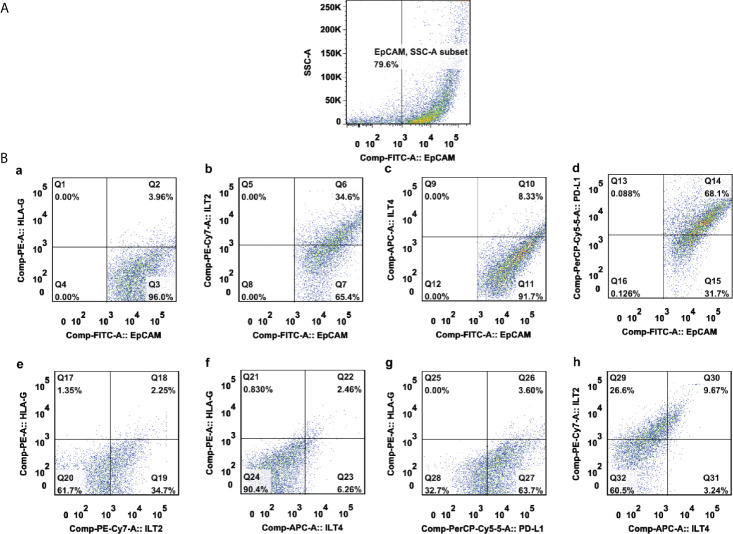
Figure 1.
A representative multicolor flow cytometry analysis of either HLA-G, ILT-2, ILT-4, and PD-L1 alone or combination in a CRC lesion. (A) EpCAM+-gated CRC tumor cells; (B) expression percentage of (a) HLA-G, (b) ILT-2, (c) ILT-4, (d) PD-L1, (e) HLA-G:ILT-2, (f) HLA-G:ILT-4, (g) HLA-G:PD-L1, and (h) ILT-2:ILT-4 among EpCAM+-gated CRC tumor cells.

