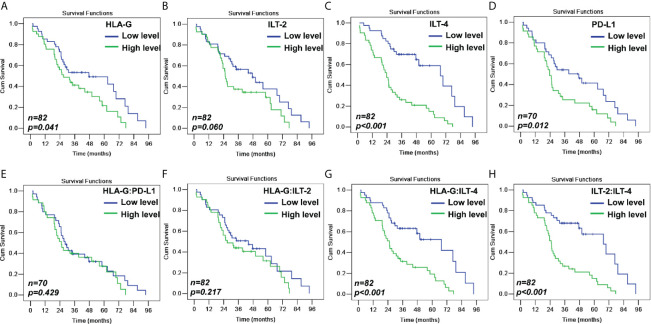
Figure 3.
Kaplan-Meier survival analysis for patients with CRC between (A) HLA-Ghigh and HLA-Glow (p=0.041); (B) ILT-2high and ILT-2low (p=0.060); (C) ILT-4high and ILT-4low (p<0.001); (D) PD-L1high and PD-L1low (p=0.012); (E) HLA-G:PD-L1high and HLA-G:PD-L1low (p=0.429); (F) HLA-G:ILT-2high and HLA-GILT-2low (p=0.217); (G) HLA-GILT-4high and HLA-G:ILT-4low (p<0.001); and (H) ILT-2:ILT-4high and ILT-2ILT-4low (p<0.001).

