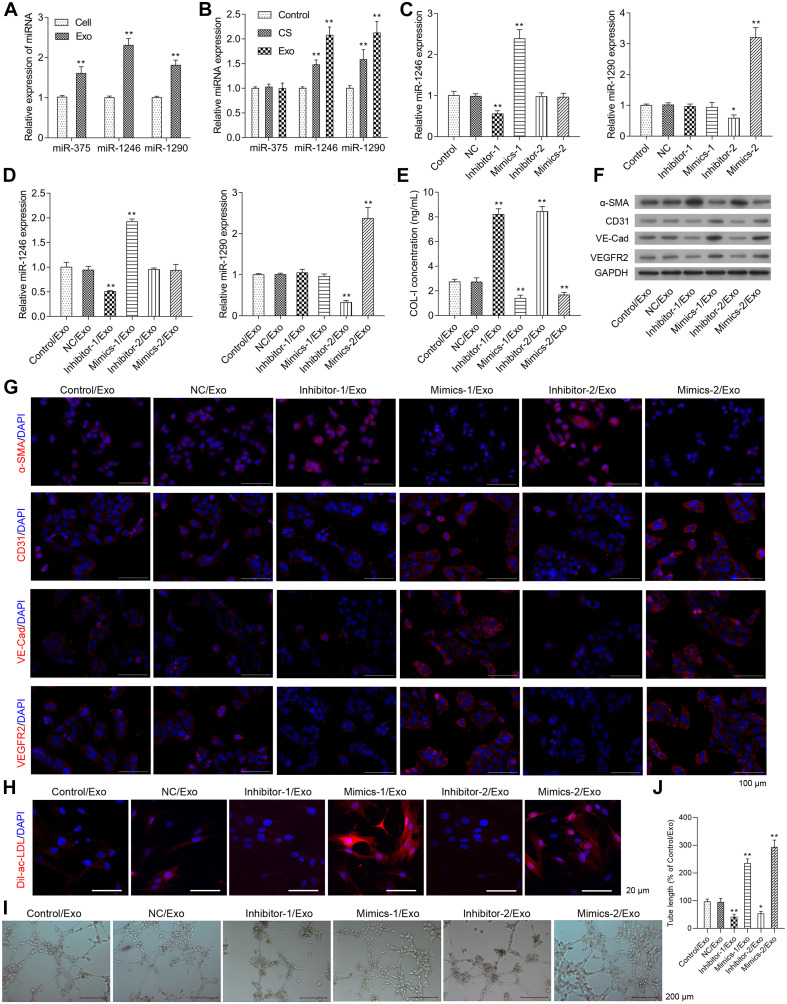
FIGURE 3.
Effects of miR-1246 and miR-1290 on angiogenesis induced by exosomes from EPCs. The miR-375, miR-1246, and miR-1290 levels in exosomes itself or in whole EPCs were determined via real-time PCR (A). After treatment with control, CS, or Exo, HCFs were harvested to determine the expressions of miR-375, miR-1246, and miR-1290 (B). The EPCs received one of the following transfections: miR-1246 inhibitor-1, miR-1246 mimics-1, miR-1290 inhibitor-2, Mimics-2, and NCs. Then, the expressions of miR-1246 and miR-1290 in exosomes derived from the parent or transfected EPCs were determined (C). HCFs were treated with exosomes from parent EPCs (Con/Exo), exosomes from EPCs transfected with NC (NC/Exo), miR-1246 inhibitor-1 (inhibitor-1/Exo), miR-1246 mimics-1 (Mimics-1/Exo), miR-1290 inhibitor-2 (inhibitor-2/Exo), or miR-1290 mimics-2 (Mimics-2/Exo). Then, the cells were collected, expressions of miR-1246 and miR-1290 were determined by qRT-PCR (D), the level of Collagen-I (Col-I) in the medium was determined by ELISA (E), and the expressions of α-SMA, CD31, VE-Cad, and VEGFR2 were determined by western blot (F) and immunofluorescence staining (G). Additionally, the phagocytic activity of HCFs was determined by DiL-Ac-LDL staining (H), and the angiogenesis was measured by a method of tube formation assay (I). The tube length in each group was quantified according to the results of tube formation assay (J). The cells were treated with exosomes (4 μg/ml) of EPCs for 24 h. N = 3. *P < 0.05, **P < 0.01 vs. NC/Exo group. Exo, exosomes; Mimics-1, miR-1246 mimics; Mimics-2, miR-1290 mimics; Inhibitor-1, miR-1246 inhibitor; Inhibitor-2, miR-1290 inhibitor.

