
Figure 2.
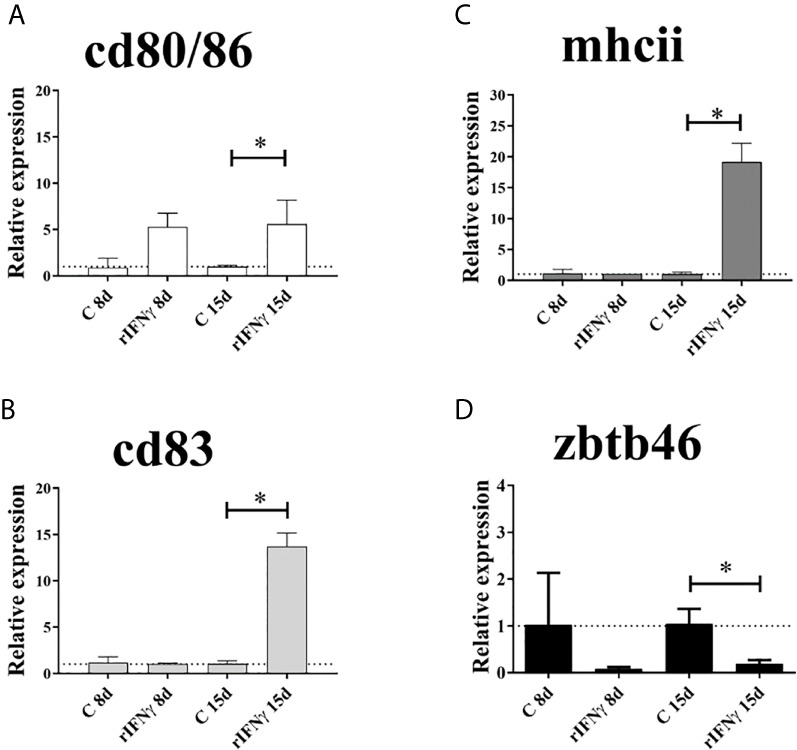
Gene expression of cell-surface markers by RT-qPCR in splenocytes of Atlantic salmon cultured 8 and 15 days (with and without induction of IFNγ). (A) cd80/86, (B) cd83, (C) mhcii and (D) zbtb46. The data were plotted in bars (n = splenocytes from four fish) showing the relative expression in fold change related to the control group. *: Significant difference (P < 0.05) by Student’s t-test two-tailed.