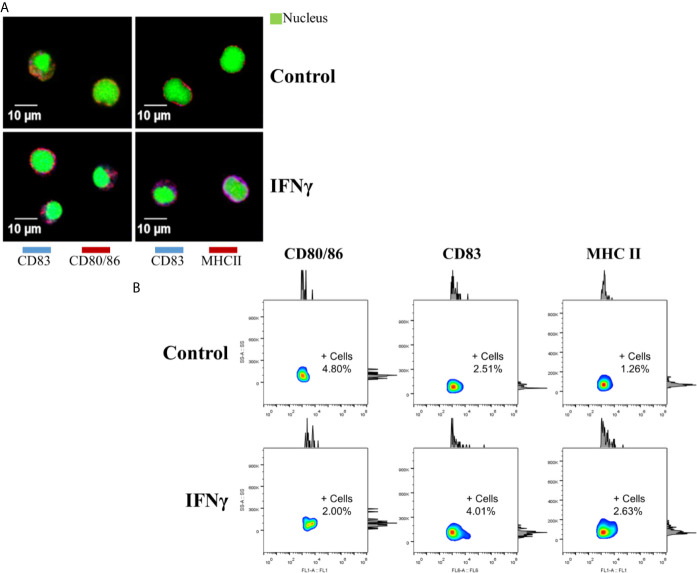
Figure 4.
Detection of cell-surface markers at the protein level. (A) Confocal microscopy of cell-surface markers in splenocytes of Atlantic salmon cultured for 15 days. Top panels (left and right), cells without IFNγ (control). Lower panels (left and right), cells with IFNγ as inducer. Left panels: in red, CD80/86. Right panels: in red, MHCII. CD83 shown in blue, in all panels. In green (in all panels) Syto9 as a nuclear contrast. Images were taken using 800x amplification. (B) Flow cytometry in splenocytes cultured for 15 days (Side Scatter-Area versus fluorescence). Top panels: Control group without inducer. Lower panels: IFNg group. +Cells: Percentage of positive cells for the corresponding marker.

