
FIGURE 6.
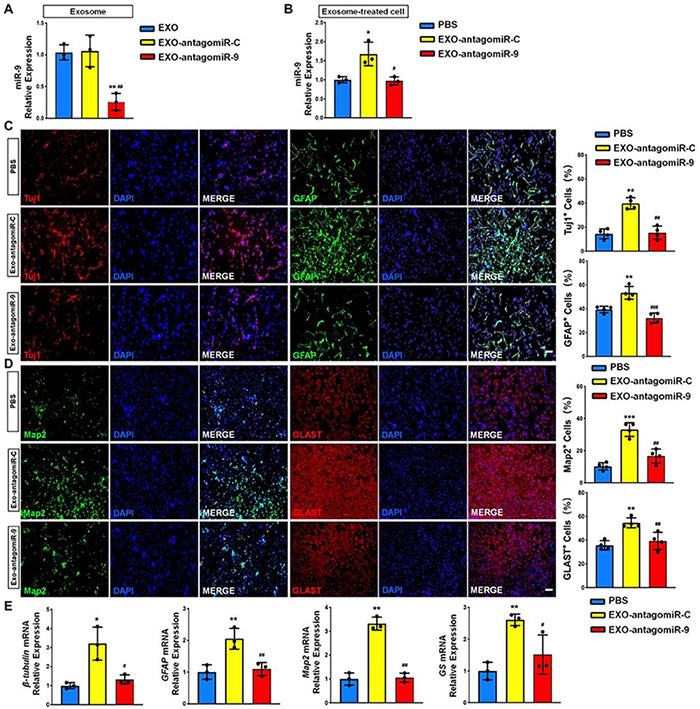
miR-9 mediates the effects of EXOs on NSC differentiation. (A) NSCs were transfected with either antogomiR-C or antogomiR-9. The knockdown of miR-9 expression levels in exosomes derived from antogomiR-9-transfected NSCs were validated by RT-qPCR. (B) NSCs treated with PBS, EXO-antagomiR-9, or EXO-antagomiR-C were cultured for 6 days in differentiation conditions. The expression levels of miR-9 in NSCs treated with PBS or exosomes were determined by RT-qPCR analysis. (C) Representative images of pre-mature cell markers (Tuj1 and GFAP) staining were shown. Proportions of cells exhibiting immunoreactivities of pre-mature cell markers (Tuj1+ and GFAP+) were determined (in the right panel). (D) Representative images of matured cell markers (Map2 and Glast) staining were shown. Proportions of cells exhibiting immunoreactivities of pre-mature cell markers (Map2+ and Glast+) were determined (in the right panel). (E) The expression levels of transcripts corresponding to pre-mature cell markers (βIII-tubulin and GFAP) and matured cell markers (Map2 and GS) were determined by RT-qPCR analysis. Data were represented as mean ± SE from three independent experiments. * and ** denote p < 0.05 and p < 0.01 in comparison to control, respectively. # and ## denote p < 0.05 and p < 0.01 in comparison to EXO-antagomiR-C group, respectively. Scale bar 100 μm in panel (C,D). ***p < 0.001, ###p < 0.001.