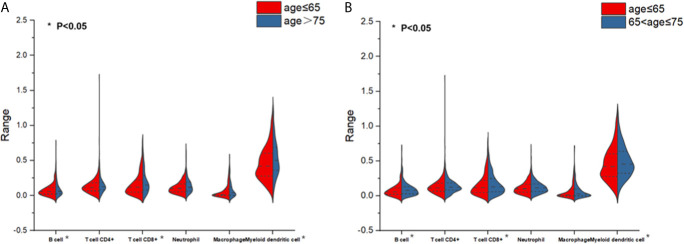
Figure 1.
Split violin plots estimating the distributions and levels of immune cell infiltration. (A) Infiltration differences of 6 immune cells between patients aged ≥75 (old patients) versus patients aged <65 (young patients). Red indicates the young patient subgroup and blue indicates the old patient subgroup. (B) Infiltration differences of six immune cells between patients aged 65 to <75 (middle-aged patients) versus patients aged <65 (young patients). Red indicates the young patient subgroup and blue indicates the middle-aged patient subgroup.

