Figure 2.
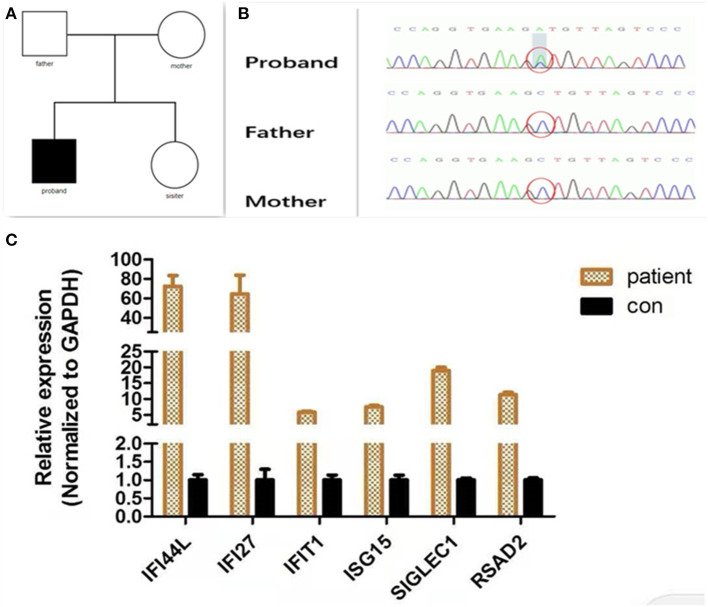
Molecular findings. (A) Family tree. (B) A de novo IFIH1 mutation c.1465G > T (p.Ala489Ser) confirmed by Sanger sequencing. (C) Quantitative analysis of interferon-stimulated genes. The expression of interferon-stimulated genes (IFI27, IFIT1, IFI44L, ISG15, SIGLEC1, and RSAD2) was analyzed by quantitative PCR. The relative expression of each interferon-stimulated gene in PBMCs (peripheral blood mononuclear cells) isolated from the patient was normalized to controls and represented as a mean and standard deviation. Control PBMCs were donated from a healthy individual who had been age- and gender-matched. All experiments were carried out in triplicate.

