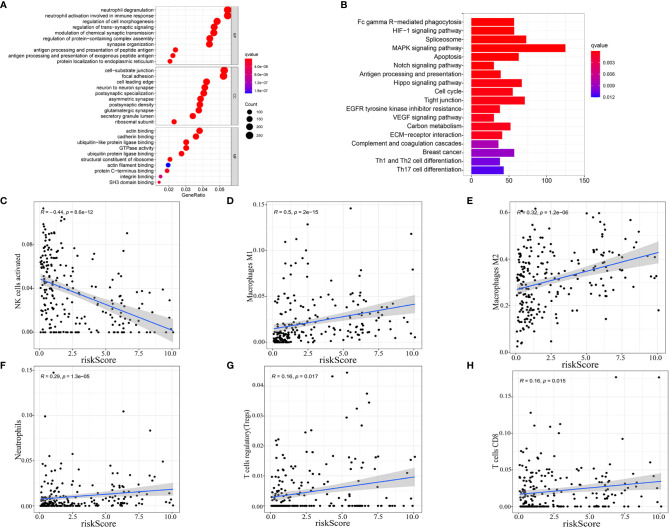
Figure 6.
Enrichment analysis and correlation with immune infiltration cells subtype. Gene ontology (GO) enrichment (A) and Kyoto Encyclopedia of Genes and Genomes (KEGG) (B) analysis based on the differentially expressed genes (DEGs) between high-risk score and low-risk score groups. (C–H) Correlation between immune cell infiltration and risk score.

