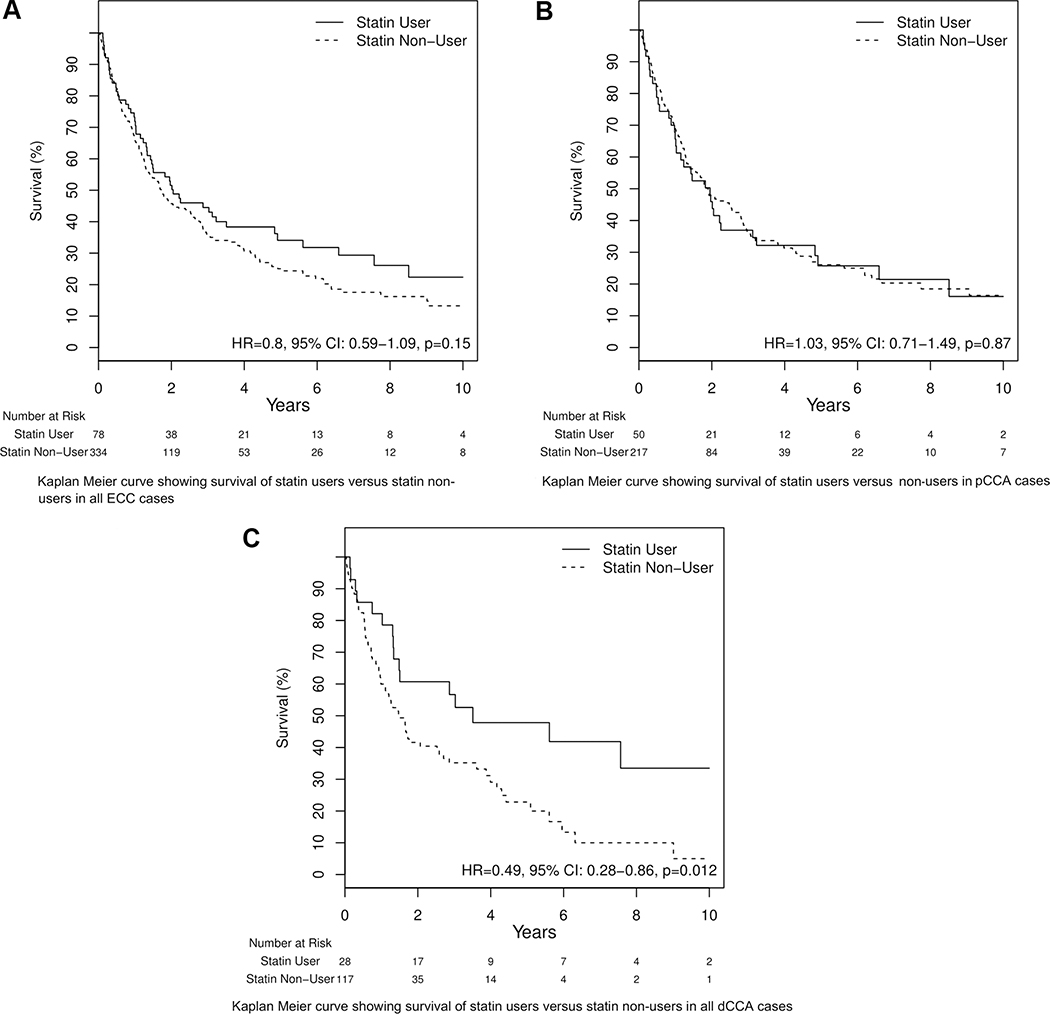
FIG. 2.
Kaplan Meier curves showing survival in ECC and its subtypes for statin users against statin nonusers. (A-C) Number at risk represents the number of patients at risk of death because of cancer at time points 2, 4, 6, 8, and 10 years from the diagnosis of cancer; (C) patients with dCCA with a history of statin use had significantly lower risk of cancer compared with statin nonusers.

