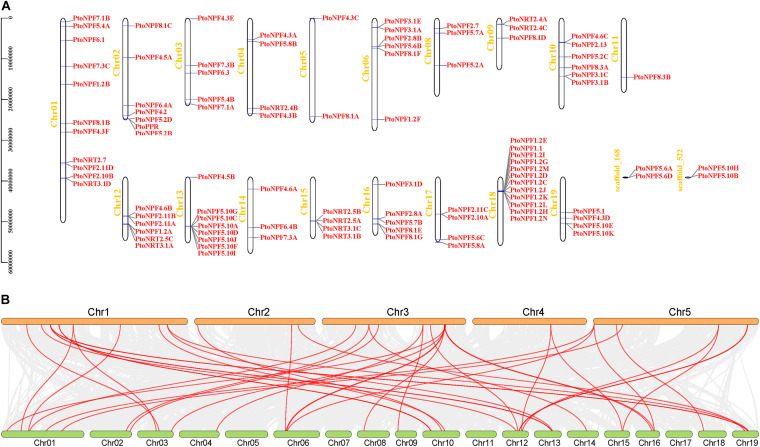
FIGURE 2.
Chromosomal distribution of PtoNRT genes and collinearity analysis between poplar and Arabidopsis. (A) Chromosomal distribution of PtoNRT genes. The TBtools genome visualization tool was used to illustrate the chromosomal distribution of PtoNRT genes. The chromosome number is shown to the left of each chromosome. The chromosomal location of each PtoNRT is presented from the top to the bottom of the corresponding chromosome. The scale bar beside each chromosome indicates the length in megabases (bp). (B) Collinearity analysis between poplar and Arabidopsis. The five chromosomes of Arabidopsis are shown at the top, and the 19 chromosomes of P. tomentosa are at the bottom. Members of the NRT gene family are marked with red lines.

